Tag: GDP

  • China’s economy is still far out growing the U.S. – contrary to Western media “fake news”

    China’s economy is still far out growing the U.S. – contrary to Western media “fake news”

    GDP data for China, the U.S., and the other G7 countries for the year 2023 has now been published. This makes possible an accurate assessment of China’s, the U.S., and major economies performance—both in terms of China’s domestic goals and international comparisons. There are two key reasons this is important.

    • First for China’s domestic reasons: to achieve a balanced estimate of China’s socialist economic situation and therefore the tasks it faces.
    • Second, because the U.S. has launched a quite extraordinary propaganda campaign, including numerous straightforward factual falsifications, to attempt to conceal the real international economic facts.

    The factual situation is that China’s economy, as it heads into 2024, has far outgrown all other major comparable economies. This reality is in total contradiction to claims in the U.S. media. This in turn, therefore, demonstrates the extraordinary distortions and falsifications in the U.S. media about this situation. It confirms that, with a few honourable exceptions, Western economic journalism is primarily dominated by, in some cases quite extraordinary, “fake news” rather than any objective analysis. Both for understanding the economic situation, and the degree of distortion in the U.S. media, it is therefore necessary to establish the facts of current international developments

    China’s growth targets

    Starting with China’s strategic domestic criteria, it has set clear goals for its economic development over the next period which will complete its transition from a “developing” to a “high-income” economy by World Bank international standards. In precise numbers, in 2020’s discussion around the 14th Five Year plan, it was concluded that for China by 2035: “It is entirely possible to double the total or per capita income”. Such a result would mean China decisively overcoming the alleged “middle income trap” and, as the 20th Party Congress stated, China reaching the level of a “medium-developed country by 2035”.

    In contrast, a recent series of Western reports, widely used in anti-China propaganda, claim that China’s economy will experience sharp slowdown and will fail to reach its targets.

    Self-evidently which of these outcomes is achieved is of fundamental importance for China’s entire national rejuvenation and construction of socialism—as Xi Jinping stated, China’s: “path takes economic development as the central task, and brings along economic, political, cultural, social, ecological and other forms of progress.” But the outcome also affects the entire global economy—for example, a recent article by the chair of Rockefeller International, published in the Financial Times, made the claim that what was occurring was China’s “economy… losing share to its peers”. The Wall Street journal asserted: “China’s economy limps into 2024” whereas in contrast the U.S. was marked by a “resilient domestic economy.” The British Daily Telegraph proclaimed China has a “stagnant economy”. The Washington Postheadlined that: “Falling inflation, rising growth give U.S. the world’s best recovery” with the article claiming: “in the United States… the surprisingly strong economy is outperforming all of its major trading partners.” This is allegedly because: “Through the end of September, it was more than 7 percent larger than before the pandemic. That was more than twice Japan’s gain and far better than Germany’s anaemic 0.3 percent increase.” Numerous similar claims could be quoted from the U.S. media.

    U.S. use of “fake news”

    Reading U.S. media claims on these issues, and comparing them to the facts. it is impossible to avoid the conclusion that what is involved is deliberate “fake news” for propaganda purposes—as will be seen, the only alternative explanation is that it is disgracefully sloppy journalism that should not appear in supposedly “quality” media. For example, it is simply absurdly untrue, genuinely “fake news”, that the U.S. is “outperforming all of its major trading partners”, or that China has a “stagnant economy”. Anyone who bothers to consult the facts, an elementary requirement for a journalist, can easily find out that such claims are entirely false—as will be shown in detail below.

    To first give an example regarding U.S. domestic reports, before dealing with international aspects, a distortion of U.S. economic growth in 2023 was so widely reported in the U.S. media that it is again hard to avoid the conclusion that this was a deliberate misrepresentation to present an exaggerated view of U.S. economic performance. Factually, the U.S. Bureau of Economic Analysis, the U.S. official statistics agency for economic growth, reported that U.S. GDP in 2023 rose by 2.5%—for comparison China’s GDP increased by 5.2%. But a series of U.S. media outlets, starting with the Wall Street Journal, instead proclaimedthat the “U.S. economy grew 3.1% over the last year”.

    This “fake news” on U.S. growth was created by statistical “cherry picking”. In this case comparing only the last quarter of 2023 with the last quarter of 2022, which was an increase of 3.1%, but not by taking GDP growth in the year as a whole “last year”. But U.S. growth in the earlier part of 2023 was far weaker than in the 4th quarter—year on year growth in the 1stquarter was only 1.7% and in the 2nd quarter only 2.4%. Taking into account this weak growth in the first part of the year, and stronger growth in the second, U.S. growth for the year as a whole was only 2.5%—not 3.1%. As it is perfectly easy to look up the actual annual figure, which was precisely published by the U.S. statistical authorities, it is hard to avoid the conclusion that this was a deliberate distortion in the U.S. media to falsely present a higher U.S. growth rate in 2023 than the reality.

    It may be noted that even if U.S. GDP growth had been 3.1% then China’s was much higher at 5.2%. But the real data makes it transparently clear that China’s economy grew more than twice as fast as the U.S. in 2023—showing at a glance that claims that the U.S. is “outperforming all of its major trading partners”, or that China has a “stagnant economy” were entirely “fake news”.

    Many more examples of U.S. media false claims could be given, but the best way to see the overall situation is to systematically present the overall facts of growth in the major economies.

    What China has to do to achieve its 2035 goals

    Turning first to assessing China’s economic performance, compared to its own strategic goals of doubling GDP and per capita GDP between 2020 and 2035, it should be noted that in 2022 China’s population declined by 0.1% and this fall is expected to continue—the UN projects China’s population will decline by an average 0.1% a year between 2020 and 2035. Therefore, in economic growth terms, the goal of doubling GDP growth to 2035 is slightly more challenging than the per capita target and will be concentrated on here—if China’stotal GDP goal is achieved then the per capita GDP one will necessarily be exceeded.

    To make an international comparison of China’s growth projections compared with the U.S., the U.S. Congressional Budget Office (CBO), responsible for the official growth projections for the U.S. economy on which its government’s policies rely, estimates there will be 1.8% annual average U.S. GDP growth between 2023 and 2023—with this falling to 1.6% from 2034 onwards. This figure is slightly below the current U.S. 12-year long term annual average GDP growth of 2.3%—12 being the number of years from 2023 to 2035. To avoid any suggestion of bias against the U.S., and in favour of China, in international comparisons here the higher U.S. number of 2.3% will be used.

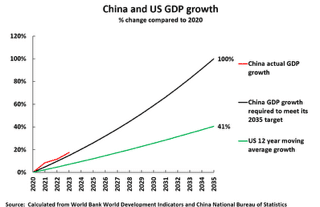
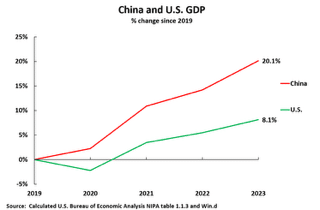
    The results of such figures are that if China hits its growth target for 2035, and the U.S. continues to grow at 2.3%, then between 2020 and 2035 China’s economy will grow by 100% and the U.S. by 41%—see Figure 1. Therefore, from 2020 to 2035, China’s economy would grow slightly more than two and a half times as fast as the U.S.

    The strategic consequences of China’s economic growth rate

    The international implications of any such growth outcomes were succinctly summarised by Martin Wolf, chief economics commentator of the Financial Times. If China’s economy continues to grow substantially faster than Western ones, and it achieves the status of a “medium-developed country by 2035”, then, in addition to achieving high domestic living standards, China’s will become by far the world’s largest economy. As Wolf put it: “The implications can be seen in quite a simple way. According to the IMF, China’s gross domestic product per head (measured at purchasing power) was 28 per cent of U.S. levels in 2022. This is almost exactly half of Poland’s relative GDP per head… Now, suppose its [China’s] relative GDP per head doubled, to match Poland’s. Then its GDP would be more than double that of the U.S. and bigger than that of the U.S. and EU together.” By 2035 such a process would not be completed on the growth rates already given, and measuring by Wolf’s chosen measure of purchasing power parities (PPPs) China’s economy by 2035 would be 60% bigger than that of the U.S. But even that would make China by far the world’s largest economy.

    Wolf equally accurately notes that the only way that such an outcome would be prevented from occurring is if China’s economy slows down to the growth rate of a Western economy such as the U.S. Clearly, if China’s economic growth slows to that of a Western economy, then, naturally, China will never catch up with the West—it will necessarily simply stay the same distance behind. Therefore. as Wolf accurately puts it the outcomes are:

    What is the economic future of China? Will it become a high-income economy and so, inevitably, the largest in the world for an extended period, or will it be stuck in the ‘middle income’ trap, with growth comparable to that of the U.S.?

    The progress in achieving China’s strategic economic goals

    Turning to the precise figure required to achieve China’s 2035 target, China’s goal of doubling GDP required average annual growth of at least 4.7% a year between 2020 and 2035. So far China, as Figure 1 shows, is ahead of this goal—annual average growth in 2020-2022 was 5.7%, meaning that from 2023-2035 annual average 4.6% growth is now required.

    China’ 5.2% GDP increase in 2023 therefore once again exceeded the required 4.6% growth rate to achieve its 2035 goal—as shown in Figure 1. From 2020 to 2023 the required total increase in China’s GDP to hit its 2035 target was 14.9%, whereas in fact its growth was 17.5%. This is in line with the 45-year record since 1978’s Reform and Opening Up, during which entire period the medium/long term targets set by China have always been exceeded.

    Therefore. to summarise, there is no sign whatever in 2023, or indeed in the period since 2020, that China will fail to meet its target of doubling GDP between 2020 and 2035—China is ahead of this target. Such a 4.6% growth rate would easily ensure China becomes a high-income economy by World Bank criteria well before 2035—the present criteria for this being per capita income of $13,846.

    It should be noted, as discussed in in detail below, that a clear international conclusion flows from this necessary 4.6% annual average growth rate for China to achieve its strategic goals. It means that China must continue to grow much faster than the Western economies throughout this period to 2035—that is in line with China’s current trend. However, if China were to slow down to the growth rate of a Western economy, then it will fail to achieve its strategic goals to 2035, may not succeed in becoming a high income economy, and will necessarily remain the same distance behind the West as now. The implications of this will be considered below.

    Systematic comparisons not “cherry picking”

    Having considered China’s performance in 2023 terms of achieving its own domestic strategic goals we will now turn to actual results and a comparison of China with other international economies. This immediately shows the factual absurdity, the pure “fake news” of claims such as that the U.S. has “the world’s best recovery“ and “the United States… is outperforming all of its major trading partners.” On the contrary China has continued to far outgrow the U.S. economy not only in 2023 but in the entire last period. China’s outperformance of the other major Western economies, the G7, is even greater that of the U.S.

    Entirely misleading claims regarding such international comparisons, used for propaganda as opposed to serious analysis, are sometimes made because data is taken from extremely short periods of time which are taken out of context—unrepresentative statistical “cherry picking” or, as Lenin put it, a statistical “dirty business”. Such a method is always erroneous, but it is particularly so during periods which were affected by the impact of the Covid pandemic as these caused extremely violent short-term economic fluctuations related to lock downs and similar measures. China’s assertion of superior growth is based on its overall performance, not an absurd claim that it outperforms every other economy, on every single measure, in every single period! Therefore, in making international comparisons, the most suitable period to take is that for since the beginning of the pandemic up to the latest available GDP data. As comparison of China with the U.S. is the most commonly made one, and particularly concentrated on by the U.S. media campaign, this will be considered first.

    China’s and the U.S.’s growth in 2023

    It was already noted that in 2023 China’s GDP grew by 5.2% and the U.S. by 2.5%—China’s economy growing more than twice as fast as the U.S. But it should also be observed that 2023 was an above trend growth year for the U.S.—U.S. annual average growth over a 12-year period is only 2.3% and over a 20-year period it is only 2.1%. Therefore, although in 2023 China’s economy grew more than twice as fast as the U.S., that figure is actually somewhat flattering for the U.S. Figure 2shows that in the overall period since the beginning of the pandemic China’s economy has grown by 20.1% and the U.S. by 8.1%—that is China’s total GDP growth since the beginning of the pandemic was two and half times greater than the U.S. China’s annual average growth rate was 4.7% compared to the US’s 2.0%.

    Economic performance of China and the three major global economic centres

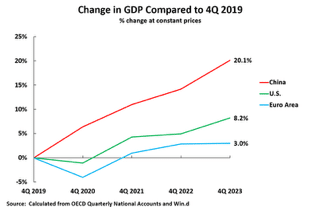
    Turning to wider international comparisons than the U.S. such data immediately shows the extremely negative situation in most “Global North” economies and China’s great outperformance of them. To start by analysing this in the broadest terms, Figure 3 shows the developments in the world’s three largest economic centres—China, the U.S., and the Eurozone. These three together account for 57% of world GDP at current exchange rates and 46% in purchasing power parities (PPPs). No other economic centre comes close to matching their weight in the world economy.

    Regarding the relative performance of these three major economic centres, at the time of writing data has not been published for the Euro Area for the whole year of 2023 —which would be the ideal comparison. However, it has been published for the the Euro area for the four quarters of 2023 individually and trends can be calculated on that basis. These show that In the four years to the 4th quarter of 2023, covering the period since the beginning of the pandemic, China’s economy has grown by 20.1%, the U.S. by 8.2%, and the Eurozone by 3.0%. China’s economy therefore grew by two and a half times as fast as the U.S. while the situation of the Eurozone could accurately be described as extremely negative with annual average GDP growth in the last four years of only 0.7%.

    Such data again makes it immediately obvious that claims in the Western media that China faces economic crisis, and the Western economies are doing well is entirely absurd—pure fantasy propaganda disconnected from reality.

    Relative performance of China and the G7

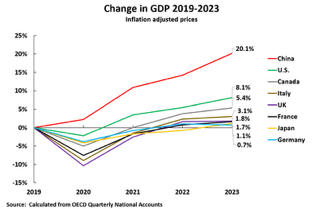
    Turning to analysing individual countries, then comparing China to all G7 states, i.e. the major advanced economies, shows the situation equally clearly—see Figure 4. Data for China and all G7 economies has now been published for the whole of 2023. The huge outperformance by China of all the major advanced economies is again evident.

    Over the four years since the beginning of the pandemic China’s economy grew by 20.1%, the U.S. by 8.1%, Canada by 5.4%, Italy by 3.1%, the UK by 1.8%, France by 1.7%, Japan by 1.1% and Germany by 0.7%.

    In the same period China’s economy therefore grew two and a half times as fast as the U.S., almost four times as fast as Canada, almost seven times as fast as Italy, 11 times as fast as the UK, 12 times as fast as France, 18 times as fast as Japan and almost 29 times as fast as Germany.

    In terms of annual average GDP growth during this period China’s was 4.7%, the U.S. 2.0%, Canada 1.3%, Italy 0.8%, the UK 0.4%, France 0.4%, Japan 0.3% and Germany 0.2%.

    It may therefore be seen that China’s economy far outperformed the U.S., while the performance of all other major G7 economies may be quite reasonably described as extremely negative—all having annual average economic growth rates of around or even under 1%.

    Comparison of China to developing economies

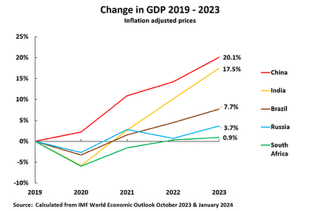
    A comparison using the IMF’s January 2024 projections can also be made to the major developing economies—the BRICS. Figure 5 shows this, using the factual result for China and the IMF projections for the other countries. Over the period since the start of the pandemic, from 2019-2023, China’s GDP grew by 20.1%, India by 17.5%, Brazil by 7.7%, Russia by 3.7% and South Africa by 0.9%.

    This data confirms that the major Global South economies are growing faster than most of the major Global North economies, which is part of the rise of the Global South and draws attention to the good performance of India. But China grew more than two and half times more than all the BRICS economies except India—China’s growth was 15% greater than India’s. It should be noted that India is at a far lower stage of development than the other BRICS economies—all the others fall in the World Bank classification of upper middle-income economies whereas India falls into the lower middle income group.

    Comparison of China’s growth to Western economies

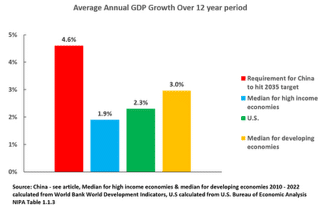
    Finally, this outperformance by China casts light on what is necessary to achieve its own 2035 strategic targets. China’s 4.6% growth rate necessary to meet these goals means that it must continue to maintain a growth rate far higher than Western economies—Figure 6 shows this in overall terms in addition to individual comparisons given to major economies above. Whereas China must achieve an annual average 4.6% growth rate the median growth rate of high income “Western” economies is only 1.9%, the U.S. is 2.3%, and the median for developing economies is 3.0%.That is, to achieve its 2035 goals China must grow twice as fast as the long term trend of the U.S., almost two and a half times as fast as the median for high income economies, and more than 50% faster than the median for developing economies. As already seen, China is more than achieving this.

    But such facts immediately show why it is an extremely misleading when proposals are made that China should move towards the macro-economic structure of a Western economy. If China adopts the structure of a Western economy then, of course, China will slow down to the same growth rate as Western economies—and therefore fail to achieve its 2035 economic goals. China will be precisely stuck in the negative outcome of the situation accurately diagnosed by Martin Wolf.

    What is the economic future of China? Will it become a high-income economy and so, inevitably, the largest in the world for an extended period, or will it be stuck in the ‘middle income’ trap, with growth comparable to that of the U.S.?

    Conclusion

    In conclusion, it addition to objectively analysing 2023’s economic results, it is also necessary in the light of this factual situation to make a remark regarding Western, in particular U.S. “journalism”.

    None of the data given above is secret, all is available from public readily accessible sources. In many cases it does not even require any calculations and simply published data can be used. But the U.S. media and journalists report information that is systematically misleading and in many cases simply untrue. While it lagged China in creating economic growth the U.S. was certainly the world leader in creating “fake economic news”! What was the reason, what attitude should be taken to it?

    First, to avoid accusations of distortion, it should be stated that there were a small handful of Western journalists who refused to go along with this type of distortion and fake news. For example Chris Giles, the Financial Times economics commentator, in December, sharply attacked “an absurd way to compare economies… among people who should know better.” Giles did not do this because of support for China but because, quite rightly, he warned that spreading false or distorted information led to serious errors by countries doing so: “Coming from the UK, which lost its top economic dog status in the late 19th century but still has some delusions of grandeur, I can understand American denialism… But ultimately, bad comparisons foster bad decisions.” But the overwhelming majority of U.S. and Western journalists continued to spread fake news. Why?

    First, the fact that identical distortions and false information appeared absolutely simultaneously across a very wide range of media makes it clear that undoubtedly U.S. intelligence services were involved in creating it—i.e. part of the misrepresentation and distortions were entirely deliberate and conscious, aimed at disguising the real situation.

    Second, another part was merely sloppy journalism—that is journalists who could not be bothered to check facts.

    Third, supporting both of these factors was “white Western arrogance”—an arrogant assumption, rooted in centuries of European and European descended countries dominating the world, that the West must be right. Therefore, such arrogance made it impossible to acknowledge or report the clear facts that China’s economy is far outperforming the West.

    But whether it was conscious distortion, sloppy journalism, or conscious or unconscious arrogance, in all these cases no respect should be given to the Western “quality” media. It is not trying to find out the truth, which is the job of journalism, it is simply spreading false propaganda.

    It remains a truth that if a theory and the real world don’t coincide there are only two courses that can be taken. The first, that of a sane person, is to abandon the theory. The second, that of a dangerous one, is to abandon the real world—precisely the danger that Chris Giles pointed to. What has been appearing in the Western media about international economic comparisons regarding China is precisely abandonment of the real world in favour of systematic fake news.


    This article was published earlier in mronline.org and is republished under Creative Commons Attribution-Non Commercial-No Derivatives 4.0 International License

    Feature Image Credit: China will continue to lead global growth in 2024 – globaltimes.cn

  • GDP data for Q3 2023–24: The mystery of a robust growth

    GDP data for Q3 2023–24: The mystery of a robust growth

    Recently released GDP figures have sprung a surprise, baffled experts and overturned the government’s own data and projections. What could be the reason

    GROSS Domestic Product (GDP) figures have sprung a surprise— showing a growth of 8.4 percent in Quarter 3 of 2023–24, on top of the previous two quarter’s growth of 8.2 percent and 8.1 percent.

    The annual growth for 2023–24 is projected at 7.6 percent. But given the growth rates in the first three quarters, it is likely to be above 8 percent, unless the economy decelerates sharply in Q4, of which there is little sign.

    The surprise

    Experts are embarrassed that how could they be so far off. In December 2023, the Reserve Bank of India (RBI) had upped its projected growth rate from 6.5 percent to 7 percent.

    Various foreign credit rating agencies had revised the expected growth rate to only around 6.5 percent. The International Monetary Fund (IMF) expected a 6.3 percent rate of growth.


    Read more…


    Read more…

  • A Taxing Tale: Assessing the Impact of Six Years of GST

    A Taxing Tale: Assessing the Impact of Six Years of GST

    Goods and Services Tax (GST) stands at a critical juncture six years after its implementation. Despite promising enormous benefits, it has fallen short and led to a decline in economic growth, especially for the unorganised sector.

    Goods and Services Tax (GST) has completed six years since it was launched on the midnight of June 30, 2017. It was billed as India’s second freedom. In a repetition of the then Parliament’s midnight meeting on August 14, 1947, the Parliament met dramatically in 2017 to hear the Prime Minister announce the launch of GST.

    It was said that the fragmented Indian market would be unified into one and a parallel was drawn with 1947, when free India had come together as a union of states.

    [powerkit_button size=”lg” style=”info” block=”true” url=”https://theleaflet.in/a-taxing-tale-assessing-the-impact-of-six-years-of-gst/#:~:text=Goods%20and%20Services%20Tax%20(GST,especially%20for%20the%20unorganised%20sector.” target=”_blank” nofollow=”false”]
    Read More
    [/powerkit_button]

  • India’s Unorganised Sector Is Being Engulfed, Further Marginalised

    India’s Unorganised Sector Is Being Engulfed, Further Marginalised

    The organised sector must consider how much can the unorganised sector be run down without hurting its own interest.

    The corporate sector is doing well, as indicated by the stock market which reflects its health. But the corporates represent only a few thousand businesses out of the crores operating in the country. Ninety-nine percent of the businesses are in the unorganised sector and reports suggest that they are declining. The official GDP for Q1 of the current financial year 2022-23 was 3.3% above its pre-pandemic level. Yet, the stock markets are close to their historic high achieved in 2021. This disjuncture between the stock market and the economy reflects the surge in corporate profits in a stagnant economy – and there is a story behind it.

    The Reserve Bank of India data on around 2,700 non-government, non-financial companies released in August 2022 shows that the sales of these companies surged 41% and net profits increased by 24% over the last year. Even if these figures are deflated by the wholesale price index (WPI) which has been rising at above 10% during this period, the corporate sector surge far exceeds the growth of the economy. If one component of the economy is rising so rapidly, the other part, the non-corporate sector in industry, must be shrinking. The difficulty with the official data is that it does not independently capture the decline of the unorganised sector (it is proxied by the growing organised sector). If the true rate of growth could be obtained, the disjuncture between the official growth rate and the rise in the stock market would be even greater.

    [powerkit_button size=”lg” style=”info” block=”true” url=”https://thewire.in/economy/indias-unorganised-sector-is-being-engulfed-further-marginalised” target=”_blank” nofollow=”false”]
    Read More
    [/powerkit_button]

  • Macrovariable Projections in Uncertain Times

    Macrovariable Projections in Uncertain Times

    International factors and faulty data will impact India’s projections of GDP, inflation and balance of payments

    The Fed has raised its benchmark interest rate again by a whopping 0.75%. The Reserve Bank of India has also been forced to raise interest rates further but also take other steps. These decisions in the Monetary Policy Committee (MPC) meeting are based on what the members of the MPC see as the likely course of…

    [powerkit_button size=”lg” style=”info” block=”true” url=”https://www.thehindu.com/opinion/lead/macrovariable-projections-in-uncertain-times/article65747423.ece” target=”_blank” nofollow=”false”]
    Read More
    [/powerkit_button]

  • India is not the Fastest Growing Big Economy

    India is not the Fastest Growing Big Economy

    A closer look at recent data on GDP shows that the numbers are flawed and recovery is incomplete

    The Provisional Estimates of Annual National Income in 2021-22 just released show that GDP grew 8.7% in real terms and 19.5% in nominal terms (including inflation). It makes India the fastest-growing major economy in the world. Further, the real economy is 1.51% larger than it was in 2019-20, just before the…

    [powerkit_button size=”lg” style=”info” block=”true” url=”https://www.thehindu.com/opinion/lead/india-is-not-the-fastest-growing-big-economy/article65515195.ece” target=”_self” nofollow=”false”]
    Read More
    [/powerkit_button]

  • 2021-22 Q1 GDP Data Overestimates: Economic Shocks Question Methodology

    2021-22 Q1 GDP Data Overestimates: Economic Shocks Question Methodology

    2021-22 Q1 GDP Data Overestimates: Economic Shocks Question Methodology: The demonetisation shock impacted the unorganised sector far more adversely than it did the organised sector

    There are methodological errors in estimating annual and quarterly GDP data, especially when there is a shock to the economy, by using projections from the previous year, dividing the annual estimates into the four quarters and using production targets as if they have been achieved, explains Professor Arun Kumar


    The Reserve Bank of India (RBI) has maintained its growth projection for 2021-22 at 9.5% while the World Bank has retained it at 8.3%. These are based on the union government’s growth estimate of 20.1% for first quarter of 2021-22—an unprecedented growth rate based on the low base in the same quarter of 2020-21, which witnessed a massive decline of 24.1%.

    A sharp rise in growth after a steep fall in the preceding year is not a new phenomenon for the economy. Prior to 1999, only annual, not quarterly, data was available. Official data shows that the economy has risen sharply several times since independence: 1953-54 (6.2%), 1958-59 (7.3%), 1967-68 (7.7%), 1975-76 (9.2%) 1980-81 (6.8%), 1988-89 (9.4%) and 2010-11 (9.8%). The data after 2011-12 base revision was controversial. For instance, the new series shows a high growth rate of 8.3% for 2016-17 though it is well known that demonetisation devastated the economy

    Methodological Issues

    If the new series, using 2011-12 as the base year, shows a high growth rate for 2016-17, the methodology is not right. This has been extensively discussed since 2015, when the series was announced. A major change has been the use of the data provided by the union ministry of corporate affairs, called the MCA-21 database, since 2015. But it has been pointed out that many of the companies in this database are shell firms and the government shut down several of them in 2018. Further, many companies were found to be missing.

    Another problem pointed out, starting the year of demonetisation, is that the measurement of the contribution of the unorganised sector—which constitutes 45% of the GDP—is not based on independent data.

    The data for the non-agriculture sector is collected during surveys every five years. In between these years, the organised sector is largely used as a proxy and projections are made from the past. Both these features of estimation pose a problem when there is a shock to the economy.

    The demonetisation shock impacted the unorganised sector far more adversely than it did the organised sector. Hence, after demonetisation, the organised sector data should not have been used as a proxy to measure the contribution of the unorganised sector. Further, due to the shock, projections from the past will not be a valid procedure. This problem was accentuated by the implementation of the Goods and Services Tax (GST), which again impacted the unorganised sector more adversely

    Demand started to shift from the unorganised sector to the organized, making the situation even more adverse. For instance, e-commerce has severely impacted the neighbourhood stores and taxi aggregators have displaced the local taxi stands.

    Due to the shocks, the earlier procedure of calculating GDP becomes invalid and should have been changed. Since this has not been done, in effect, the GDP data is measuring the organised sector and agriculture.

    Thus, 31% of the economy is not being measured, and by all accounts, this part is declining, not growing. Therefore, GDP growth is far lower than what has been officially projected since 2016-17.

    The pandemic and the lockdown have administered the biggest shock to the economy. But the organised sector was hit far less than the unorganised sector. The split between the two sectors has been far greater than due to demonetisation or GST. Therefore, there is an urgent need to revise the method of calculating GDP—also, projections from the past do not make sense.

    Quarterly Data Issues

     The problem is even greater when projecting quarterly GDP growth. The data used is sketchier than the annual data. Not only most of the data for the unorganised sector is unavailable (except for agriculture), even the organised sector data is partial. For instance, the data for businesses is based on companies that declare their results in that quarter. Only a few hundred companies out of the thousands might be declaring such data.

    Worse, the estimation is based on a) projections for the same quarter in the preceding year same quarter, b) in many cases, the projection is not just for the quarter but for the year as a whole and then it is divided into four to get the data for one quarter and c) cases where targets, not actual production data. are used to estimate the contribution to GDP.

    Worse, the estimation is based on a) projections for the same quarter in the preceding year same quarter, b) in many cases, the projection is not just for the quarter but for the year as a whole and then it is divided into four to get the data for one quarter and c) cases where targets, not actual production data. are used to estimate the contribution to GDP.

    Fishing and aquaculture, mining and quarrying, and quasi-corporate and the unorganised sector are a few sectors which belong to the first group. Some sectors belonging to the second category are other crops, major livestock products, other livestock products and forestry and logging. Livestock belongs to the third category, where annual targets/projections are used.

    This procedure is clearly inadequate but maybe acceptable in a normal year. But when there is a shock to the economy, does it make sense? If there is a projection from the previous year, it is likely to give an upward bias since the economy was performing better in the preceding year. Further, projections have to be based on some indicators and the data on these indicators were only partially available due to the lockdown.

    Finally, how can the annual projection be made and then divided into four to obtain the quarterly estimate when the economy is highly variable from quarter to quarter. In 2020, each quarter was very different from the previous one.

    Next, if the data for 2020-21 is erroneous, when there was a massive slump in the economy, the shock continues into 2021-22. How can projections be made from the 2020-21 to 2021-22? Thus, there would be large errors in the quarterly data for the current year. This will then be fed into the data for 2022-23. Therefore, the shock to the economy will play itself out for several years.

    Impact on other Macro Variables

    Quarterly data are also published for other macro variables like consumption, and investment by public and private sectors. The government-related data is available in the Budget documents, but the private sector data poses a huge challenge. These estimates are, again, based on projections from the previous year, and in some cases, annual estimates are divided between quarters. Production data is also used to project consumption and investment by the private sector. So, if the former is incorrect, as pointed out above, then the estimates for the latter will also be erroneous.

    The RBI’s survey of the organised sector showed that capacity utilisation was down to 63% in January 2021, but the official quarterly data was showing a growth of 1.3% rather than a decline of 10%. Thus, the quarterly data was not representative of even the organised sector.

    Similarly, consumer sentiment was down to 55.5 compared to 105 a year back, implying that even the organised sector consumption had not recovered to the pre-pandemic levels. Both these variables were further dented in the second wave of COVID-19 in Q1 of 2021-22. The implication is that the data on these variables is also not reliable.

    If the production data is an overestimate due to the use of projections from the last year, the consumption and investment data would also be over projections. The further implication is that if the data for 2020-21 is not right, the quarterly data for 2021-22, projected from the previous year, will also be erroneous and overestimate.

    Analysis of Macro Variables for Q1 of 2021-22

    For the moment, let us analyse the Q1 data leaving aside the errors pointed out above. When the economy was in decline in the preceding year, comparing rates of growth makes less sense than comparing the level of GDP.

    On a low base of 2020-21 (-24.4%), the rate of growth for 2021-22 looks impressive (+20.1%). But it is 9.2% less than the pre-pandemic Q1 of 2019-20—i.e., the economy has not recovered to the pre-pandemic level.

    Further, if the economy was growing at the pre-pandemic rate, the economy would have expanded another 7.5% in two years. Thus, compared to the possible level of GDP in 2021-22, it is down by about 16%.

    Except for agriculture and the utilities sectors, data shows that none of the other sectors have recovered to the levels in 2019-20. Private final consumption expenditure is down by 11.9% and gross fixed capital formation by 17.1%. Government consumption expenditure and exports have increased compared to their levels in 2019-20. The former does give a boost to the economy by increasing demand but the latter does not since imports remain much higher than exports.

    Therefore, out of the four sources of demand, only government expenditure has increased—but this is not enough to compensate for the decline in the other three and that is why the economy is still down compared to 2019-20.

    It may be argued that over time, data undergoes revision as more data becomes available. But the situation now is unusual due to the pandemic. This necessitated a major revision in the methodology itself due to lack of data and consequent non-comparability across quarters and years.

     The views expressed are those of the author.

    This article was published earlier in NEWSCLICK.

    Image Credit: The Federal


  • Living Next to China: India’s Economic Challenge

    Living Next to China: India’s Economic Challenge

    Abstract

    Hampered by declining economic growth, India needs to take bold and practical economic measures to overcome the adverse impact of the coronavirus pandemic, compounded by past economic blunders such as the demonetisation and the haphazard implementation of the GST regime. Mohan Guruswamy analyses that the seeds of the current economic slide were sown by the UPA II regime by its populist measures that were wasteful, unproductive, and reduced capital expenditure. Non action by the NDA governments on these issues has made it worse. He argues that India must not shy away from recourse to deficit financing to overcome the current unprecedented challenges faced by the economy on account of the Covid-19 disruption. India needs to increase its stimulus package from a mere 0.3% of the GDP to at least 10% to boost economic revival and growth. India’s reserves of $490 billion ($530 billion as of recent figures) is available to be tapped for economic revival. The measures must focus on addressing the severe impact on weaker sections of the society such as the poor, lower middle-class, and the farmers.

    The Covid2019 shock hit all world economies and has caused a serious contraction in all of them. Ironically, in the advanced economies like the USA, UK, Japan, and others, it exposed their intrinsic strengths with highly evolved social security systems by and large being able to absorb the labor displacement and the ability to quickly put together a fiscal fight back plan. Even China has been able to quickly recover its pole position as the worlds leading exporter and industrial production center. In India, Covid2019 exposed our co-morbidities, and has further opened the traditional faultlines, with the large unorganized labor cohort bearing the brunt of the costs. At last count the CMIE estimates over 130 million daily wagers in the urban centers being rendered jobless and homeless.[i] India’s economy which has been in distress for most of the last decade in now seriously stricken.

    When India’s economic history is written in some future date, and when a serious examination is done of when India lost its way to its ‘tryst with destiny’, the decade of 2010-20 will be highlighted.

    When India’s economic history is written in some future date, and when a serious examination is done of when India lost its way to its ‘tryst with destiny’, the decade of 2010-20 will be highlighted. The facts speak for themselves. India’s real GDP growth was at its peak in March 2010 when it scaled 13.3%.  The nominal GDP at that point was over 16.1%. The nominal GDP in September 2019 was at 6.3%, it’s lowest in the decade. Since then the downward trend is evident and we are now scraping the bottom at about a real GDP growth rate of 4.5%, this too with the push of an arguably inflationary methodology. Our previous CEA, Arvind Subramaniam, estimated that India’s GDP growth is overestimated by at least 2.5%. BJP MP and economist Subramaniam Swamy was even more pessimistic. He estimated it to be 1.5%.

    The decline in the promise is amply evident by the change in the make up of the economy during this decade.  In 2010 Agriculture contributed 17.5% of GDP, while Industry contributed 30.2% and Services 45.4%.  In 2019 that has become 15.6%, 26.5% and 48.5% respectively.  The share of industry has been sliding.  This is the typical profile of a post-industrial economy.  The irony of India becoming post-industrial without having industrialized must not be missed.

    Decline in Capital Investment

    The most significant cause for the decline of growth is the decline in capital investment.  It was 39.8% of GDP in 2010 and is now a good 10% lower.  Clearly without an increase of capital investment, one cannot hope for more industrialization and hence higher growth.  What we have seen in this decade is the huge increase in Services, which now mostly means increase in Public Administration and informal services like pakora sellers.

    In 2010 it seemed we were well on track.  But now we are struggling to get past $3 trillion, and the $5 trillion rendezvous that Modi promised by 2024 will have to wait longer.

    At the turn of the century, as China’s GDP began its great leap forward (from about $1.2 trillion in 2010 to $14.2 trillion in 2019), was also a heady moment for India whose GDP of $470 billion began a break from the sub 5% level of most of the 1990’s to the rates we became familiar with in the recent past (to hit a peak stride of 10.7% in 2010). At that point in time, if growth rates kept creeping up, we could have conceivably gone past $30 trillion by 2050. But for that the growth rate should consistently be above 7%. It seemed so feasible then.  In 2010 it seemed we were well on track.  But now we are struggling to get past $3 trillion, and the $5 trillion rendezvous that Modi promised by 2024 will have to wait longer.

    To be fair to Modi and the NDA, the decline began early in the second term of the UPA when capital expenditure growth had begun tapering off.  Dr. Manmohan Singh is too canny an economist to have missed that.  But UPA II also coincided with the increasing assertion of populist tendencies encouraged by the Congress President and her extra-Constitutional National Advisory Council. The decline in the share of capital expenditure was accompanied by a huge expansion in subsidies, most of them unmerited.  Instead of an increase in expenditure on education and healthcare, we saw a huge expansion in subsidies to the middle and upper classes like on LPG and motor fuels. Even fertilizer subsidies, which mainly flow to middle and large farmers with irrigated farmlands, saw a great upward leap.  Clearly the money for this came from the reduction in capital expenditure.  Modi’s fault in the years since 2014 is that he did nothing to reverse the trend, and only inflicted more hardship by his foolish demonetization and ill-conceived GST rollout.

    The realities are indeed stark.  The savings/GDP ratio has been in a declining trend since 2011 and Modi has been unable to reverse it.  Consequently, the tax/GDP ratio and the investment/GDP ratio have also been declining.  The rate of economic growth has been suspect and all objective indicators point to it being padded up. The drivers of economic growth such as capital expenditure is dismal.  Projects funded by banks have declined by over half since 2014 to less than Rs.600 billion in 2018-19.  Projects funded by the market have dropped to rock bottom.  Subsequently the manufacturing/GDP ratio is now at 15%.  Corporate profits/GDP ratio is now at a 15-year-old low at about 2.7%.  You cannot have adequate job creation if these are dipping.  Declining rural labor wage indices testify to this.

    Between October 2007 and October 2013 rural wages in the agricultural and non-agricultural sectors grew at 17% and 15%, respectively.  Since November 2014, however, agricultural and non-agricultural sector wages grew at only 5.6% and 6.5%, respectively. In 2019 average rural wage growth has further fallen to 3.1%.[ii]

    Bharat and India Divide

    It is very clear now that the urban lane has been moving well in India.  Indeed, so well that an Oxfam study revealed that that as much as 73% of the growth during the last five years accrued to just 1% of the population.[iii] This does not mean it is just the tycoons of Bombay and Delhi who are cornering the gains.  Government now employs close to 25 million persons, and these have now become a high-income enclave.  The number of persons in the private and organized sector is about another ten million. In all this high-income enclave numbers not more than 175-200 million (using the thumb rule of five per family).  Much of the consumption we tend to laud is restricted to just these.

    The simple fact that the share of Agriculture is now about 15.6% of GDP and falling, while still being the source of sustenance for almost 60% of the population reveals the stark reality.  A vast section of India is being left behind even as India races to become a major global economy.

    Agriculture is still the mainstay of employment.  Way back in 1880 the Indian Famine Commission “had observed that India had too many people cultivating too little land”.  This about encapsulates the current situation also.  While as a percentage the farmers and farmworkers have reduced as a part of the work force, in absolute terms they have almost tripled since 1947.  This has led to a permanent depression in comparative wages but has also led to a decline in per farmer production due to fragmentation of holdings.  The average farm size is now less than an acre and it keeps further fragmenting every generation.[iv] The beggaring of the farming community is inevitable.  The only solution to this is the massive re-direction of the workforce into less skilled vocations such as construction.

    The simple fact that the share of Agriculture is now about 15.6% of GDP and falling, while still being the source of sustenance for almost 60% of the population reveals the stark reality.  A vast section of India is being left behind even as India races to become a major global economy.

    As the decade ends, the Bharat and India divide have never been more vivid.  Our social scientists are still unable to fix a handle to this because the class, cultural and ethnic divides still eludes a neat theoretical construct.  Yet there can be little disagreement that there are two broad parts to this gigantic country and one part is being left behind.  The distance between the two only increased from 2010 to 2020.  This is indeed the lost decade.  Recovering from this will take long and will be painful.  If we take too long, we might have used up a good bit of the ‘demographic dividend’ and the demographic window of opportunity.  The ageing of India will be upon us by 2050[v].

    Covid-19 Impact – Increasing Economic Disparities 

    In the recent months the onslaught of the Covid2019 induced lockdown has been quite relentless.  From 2004-2014 India’s GDP grew at an average of 7.8%.  At its peak it went past 10% in 2010-11 Then it started slowing down.  The new government was unable to return to the old growth rates because it did not care to learn from the experiences of the previous regime, which began to spend more on giveaways, misguidedly thinking it was welfare economics, and took the accelerator off capital expenditure.  Even though capital expenditure is driven in India by government spending, this government spending is very different from subsidies and giveaways.  Subsidies generally tend to be misdirected with the already well-off garnering most of it.  Minimum Support Prices (MSP) are a huge annual subsidy[vi]and 90% of it accrues to the states of Punjab, Haryana, and the coastal region of Andhra Pradesh.  Fertilizer subsidies tend to accumulate to the advantage of large and medium farmers or to about a quarter of all land holdings.  Ditto for free power.  The only welfare expenditure to benefit farmers is investment in irrigation, rural infrastructure, and social welfare like education and health.  Unfortunately, this has been on the decline.  This has exacerbated disparities, both local and regional.  With capital expenditures declining, job creation suffered and the inevitable slowdown of GDP growth happened.  As we started diving, the government inflicted the so-called Demonetization adding to our woes.  Just as things began to look up, the Covid2019 pandemic overtook us.

    Now the only dispute on national income is how much will be the contraction.  The Finance Ministry hopes there won’t be any. The IMF has officially said it will be 4.5%.  The rating agencies predict a contraction of 6.8%, while many more are suggesting something closer to 10%.  How do we deal with is now?  The government of India has tended to be “conservative” in its outlook and has made no serious suggestion on economic stimulus.  What it calls a stimulus is actually not a stimulus. The problem is more philosophical.

    The divide between the Keynesians and the Chicago school is as intense and often antagonistic as the Sunni-Shia, Catholic-Protestant or Thenkalai-Vadakalai Iyengar divides.

    Keynesian economics is a theory that says the government should increase demand to boost growth. Keynesians believe consumer demand is the primary driving force in an economy.  As a result, the theory supports expansionary fiscal policy.  The Chicago School is a neoclassical economic school of thought that originated at the University of Chicago in the 1930s.  The main tenets of the Chicago School are that free markets best allocate resources in an economy and that minimal or zero government intervention is best for economic prosperity.  They abhor fiscal deficits.

    Inadequate Stimulus Package 

    The instruments used to beat countries like India into submission are ratings agencies such as Moody’s, which just downgraded India.  We shouldn’t lose too much sleep over it.  India is a hardly a borrower abroad and is more of a lender holding $490 billion as reserves.

    The only reason why the actual stimulus package is only Rs.63K crs is the obsession with fiscal deficits by Chicago economists such as Raghuram Rajan and his former student the hapless Krishnamurthy Subramaniam, the present CEA. They are true disciples of the Washington Consensus to judge countries like India by the fiscal deficit size.  The instruments used to beat countries like India into submission are ratings agencies such as Moody’s, which just downgraded India.  We shouldn’t lose too much sleep over it.  India is a hardly a borrower abroad and is more of a lender holding $490 billion as reserves.

    That is why the CEA when asked about a big stimulus said: “There are no free lunches!” That’s exactly what Milton Friedman said. But they quite happily ignore the biggest deficit financed economy in the world is the USA.  Raghuram Rajan told Rahul Gandhi on his videoconference that a stimulus of Rs.65K crores would suffice in the present situation[vii]. The Nobel Laureate Abhijit Bhattacharya and former CEA Arvind Subramaniam suggest a stimulus package like the USA or Japan[viii].  The USA has just announced a stimulus of over $3.5 trillion or over 15% of GDP.  Modi’s stimulus is a mere 0.3% of GDP.

    What is ‘Fiscal Deficit?’ A fiscal deficit occurs when a government’s total expenditures exceed the revenue that it generates, excluding money from borrowings.  Deficit differs from debt, which is an accumulation of yearly deficits.

    Many serious economists regard fiscal deficits as a positive economic event.  For instance, the great John Maynard Keynes believed that deficits help countries climb out of economic recession.  On the other hand, fiscal conservatives feel that governments should avoid deficits in favor of balanced budgets.

    India’s debt/GDP ratio is by contrast a modest 62% and yet it intends to pump in a mere 0.3% of GDP as stimulus.

    The fastest growing economies in the world, and now its biggest – USA, China, Japan and most of Western Europe – have the highest debt/GDP ratios.  Japan’s debt/GDP is over 253% before the latest stimulus of 20% of GDP.  China’s debt is now over 180% of its GDP.  The USAs debt/GDP is close to 105% yet it is raising $3 trillion as debt to get it out of the Covid2019 quagmire.  India’s debt/GDP ratio is by contrast a modest 62% and yet it intends to pump in a mere 0.3% of GDP as stimulus.

    Pump priming the economy by borrowing per se is not bad.  It is not putting the debt to good use that is bad.  Nations prosper when they use debt for worthwhile capital expenditure with assured returns and social cost benefits.  But we in India have borrowed to give it away as subsidies and to hide the high cost of government.  To give an analogy, if a family has to make a choice of borrowing money to fund the children’s education or to support the man’s drinking habit, the rational choice is obvious. The children’s education will have a long-term payback, while the booze gives instant gratification. But unfortunately, our governments have always been making the wrong choices.

    If borrowed money is used productively and creates growth and prosperity, it must be welcomed.  What we want to hear from the government is not about fiscal deficit targets, but economic growth, value addition, employment, and investment targets.  Our governments have hopelessly been missing all these targets.

    Modi’s Options – Need for Bold Decisions

    So, what can Modi do now to get us out of this quagmire?  If the regime abhors a stimulus financed by deficit financing there are other options that can be exercised.  But he is hamstrung with a weak economic management team with novices as the two key players, the Finance Minister and RBI governor.

    India has over $490 billion nesting abroad earning ridiculously low interest.  Even if a tenth of this is monetized for injection into the national economy, it will mean more than Rs.3.5 lakh crores.  At last count the RBI had about Rs.9.6 lakh crores as reserves.  This is money to be used in a financial emergency.  We are now in an emergency like we have never encountered or foresaw before. Even a third of this or about Rs.3.2 lakh crores is about five times the present plan.

    There is money in the trees, and all it needs is a good shake up to pick the fruits. The pain of the lockdown must not be borne by the poor alone.  The government can easily target 5% of GDP or about Rs.10L crores for the recovery fund as an immediately achievable goal.

    There are other sources of funds also, but tapping these will entail political courage and sacrifices. Our cumulative government wages and pension bill amounts to about 11.4% of GDP.  After exempting the military and paramilitary, which is mostly under active deployment, we can target 1% of GDP by just by cancelling annual leave and LTC, and rolling back a few DA increases.

    The government can also sequester a fixed percentage from bank deposits, say 5% of deposits between Rs.10-100 lakhs and 15-20% from bigger deposits for tax-free interest-bearing bonds in exchange.  The ten big private companies alone have cash reserves of over Rs.10 lakh crores[ix].

    There is money in the trees, and all it needs is a good shake up to pick the fruits. The pain of the lockdown must not be borne by the poor alone.  The government can easily target 5% of GDP or about Rs.10L crores for the recovery fund as an immediately achievable goal.

    This money can be used to immediately begin a Universal Basic Income scheme, by transferring a sum of Rs.5000 pm into the Jan Dhan accounts for the duration of the financial emergency; fund GST concessions to move the auto and engineering sectors in particular; begin emergency rural reconstruction projects to generate millions of new jobs and get our core infrastructure sectors like steel, cement and transportation moving again.

    Getting money to move India again is not a huge problem.  What comes in between are the philosophical blinkers.  Call it Chicago economics or the Gujarati mindset.

    Notes

    [i] https://www.businesstoday.in/sectors/jobs/india-unemployment-rate-hits-26-amid-lockdown-14-crore-lose-employment-cmie/story/401707.html

    [ii] https://www.financialexpress.com/economy/farm-wages-growth-fell-to-a-four-quarter-low-in-q3-fy-20/1789235/

    [iii] https://economictimes.indiatimes.com/news/economy/indicators/wealth-of-indias-richest-1-more-than-4-times-of-total-for-70-poorest-oxfam/articleshow/73416122.cms?from=mdr#:~:text=Wealth%20of%20India’s%20richest%201%25%20more%20than%204%2Dtimes%20of,total%20for%2070%25%20poorest%3A%20Oxfam&text=The%20Oxfam%20report%20further%20said,particularly%20poor%20women%20and%20girls.

    [iv] https://www.prsindia.org/policy/discussion-papers/state-agriculture-india

    140 million hectares of land is used as agricultural area, as of 2012-13.  Over the years, this area has been fragmented into smaller pieces of land.  As seen in Table 3, the number of marginal land holdings (less than one hectare) increased from 36 million in 1971 to 93 million in 2011.  Marginal and small land holdings face several issues, such as problems with using mechanization and irrigation techniques.

    [v] https://economictimes.indiatimes.com/news/politics-and-nation/demographic-time-bomb-young-india-ageing-much-faster-than-expected/articleshow/65382889.cms

    [vi] https://www.thehindubusinessline.com/opinion/all-you-wanted-to-know-about-minimum-support-price/article7342789.ece

    [vii] https://www.hindustantimes.com/india-news/in-video-conversation-with-rahul-rajan-suggests-65k-crore-aid-for-poor/story-CtrtvW6HErR16L9m1t9wHP.html

    [viii] https://economictimes.indiatimes.com/news/economy/policy/rahul-gandhi-in-conversation-with-abhijit-banerjee-india-needs-a-bigger-stimulus-package-like-us-japan-to-revive-economy/videoshow/75549770.cms

    [ix] https://www.screener.in/screens/2551/Cash-Rich-Companies/


    Image credit: Adobe Stock

  • Lebanon’s Economic Crisis and Political Unrest

    Lebanon’s Economic Crisis and Political Unrest

    The Lebanon crisis illustrates the outcome of an inefficiently regulated market economy, shaped by long-term instant gratification of economic policies. Economy is run by corrupt institutions with ingrained crony capitalism, bureaucratic regulations and over-reliance on foriegn exchange.

    Lebanon is a free market economy in West Asia, bordered by Syria and Israel and the Mediterranean Sea, and hence, was a frequent recipient of spillovers of unrest and refugee crisis from the neighbouring countries. It is a service-sector dominated (majorly, banks and tourism) economy with a GDP of $56.9 billion─ growth rate of 0.2%, compared to 0.6% the previous year and a workforce of 2.4 million out of which 30 percent include Syrian refugees. The country relies heavily on imports (consumer goods, machinery and equipment etc) with a low dependence on exports (vegetables, non-precious metals and textiles). For years, Lebanon used foreign remittances such as transfers from non-resident Lebanese, foreign deposits and high government loans to balance the trade deficit. Lebanon exchange rate had been kept fixed at 1500 pounds per dollar which was also a fiduciary currency in Lebanon. Thus the higher demand for dollars to fixate the exchange rate, and meet the domestic demand for dollars, is levelled using foreign deposits by offering high yield rates, which had to be further funded by more deposits at even higher interest rates. These faulty policies had sustained the economy until interest payments had snowballed into heavy burden.

    Figure 1: trend of GDP per capita in Lebanon

    Source: Trading Economics

    Lebanese economy is also characterized by high government debt, substantially from domestic banks, borrowed primarily for reconstruction of the economy post civil war (1975-90). Over the years, the government relied more heavily on deficit financing to meet government spending, while the weak governance and corrupt politicians moved along with unfulfilled reforms and poor economic development. There was an underprovision of basic necessities like hassle-free electricity supply, regular water and waste management. On the other hand, crony capitalism had built up, with favours laid out to private businesses which were ultimately owned by rich, exploitative politicians. The debt-to-GDP ratio peaked to 150% by 2019, with a budget deficit of 11.5% of GDP and 50% of the revenues are consumed in debt servicing. This led to an economic crisis, followed by a political crisis, and ultimately snowballed into a financial crisis, rendered vulnerable and  in desperate need of foreign aid to see the day.

    Evidently, though Lebanon crisis started in late 2019, it is the result of long term economic policies mismanaged by corrupt political elite; when the government proposed to tax ‘free-calls in Whatsapp’ to meet the mounting budget deficit in October 2019, protests erupted across the country, catapulting into political unrest and ousting the prime minister. Investors and citizens lost confidence in the system, and led to reducing capital inflows.

    Their sovereign bonds were rated as highly risky assets (probable default),  leading to interest rates as high as 15%. The political uncertainty and the liquidity crunch, led to freezing of external deposits, while the steady domestic and foreign demand for dollars persisted, leading to a shortage of USD. The banks levied restrictions (weekly quotas) on dollar withdrawals, the dollar rate spiked, depreciating the pound, and reducing the purchasing power of the pound. This had squeezed the middle and low income strata the most, draining their last pounds of savings, since their debts substantially constituted dollar repayments. Businesses relying on dollars for most part were affected as the price of imports sky-rocketed, and the oil crunch tightened until the central government stepped in to ease the situation. The condition degraded further by the onset of Coronavirus and the lockdown, which led to widespread unemployment and inflation. The World Bank estimated that 50% of Lebanese population could be pushed below the poverty line by 2020 if immediate action is not taken.

    The debt of Lebanon has built up to 124464 billion LBP, i.e nearly $82 billion and the country has become the 3rd most indebted country in the world. In March 2020, Lebanon government, as a decisive step to prioritize the domestic concerns of the country and retain sustainable foreign exchange reserves in the economy, had defaulted on the Eurobond debt of $1.2 billion for the first time. The ailing economy seeks to restructure the other outstanding debts amounting to $31 billion and has been seeking advice, especially from the IMF on debt restructuring measures. There is a need for an ‘economic rescue plan’ to protect the depositors from this worst economic crisis Lebanon has faced.

    Figure 2: trend of Lebanon government’s debt

    Source: Trading Economics

    Foreign aid from the institutions is a big responsibility, as it would demand austerity measures from the economy that had dwelled in capitalistic pleasures for so long. Though, CEDRE and foreign countries like France and UK have promised ‘soft’ loans to the Lebanese government, economists believe that external aid would be unproductive, and will become an additional debt burden on the already bleeding financial system unless government inculcates greater transparency and accountability to the public, ousting corruption and following through on long-term economic policies with commitment.  Lebanon government is also seeking aid from the IMF. But  this would certainly entail strict reform targets linked to the outflow of credit and hence, is very unlikely.

    For the immediate future, Lebanon’s economic policies should be directed towards increasing  self-reliance in the economy, with higher focus on manufacturing sectors to create employment. Financial policies to stabilize the economy are of primary concern. It is time to make up for the blunders of non-performing investments in the electricity industry. Investments on infrastructural development should be realized and substantial attention should be given to improving  socio-economic conditions of the people. Construction and manufacturing industries should be supported. Actions should be taken to handle the refugee situation, and check the drain of human capital out of the country.   It could be said that Lebanon’s government has a long way to go before it can regain the confidence of its people and the foreign investors in order to stabilize the economy.

    Current Scenario

          Covid 19 has a destructive and deleveraging impact on all the economies, and Lebanon is no exception. The economy is heavily dependent on the service sector, especially tourism, and foreign remittances. The impact of the coronavirus pandemic has been devastating on the money the expats send home, which makes up nearly 12.7% of the GDP, making Lebanon the second-most remittances dependent middle-eastern country, only behind Palestine. Amid the collapsing economy and the disruption triggered by the Covid-19 pandemic, the only certainty is the gathering pace of Lebanon’s political unrest.


    REFERENCES

    https://www.nytimes.com/2019/11/15/world/middleeast/lebanon-protests-economy.html?action=click&module=RelatedLinks&pgtype=Article

    https://www.nytimes.com/2020/05/10/world/middleeast/lebanon-economic-crisis.html

    https://www.trtworld.com/magazine/what-s-behind-lebanon-s-economic-crisis-35874

    https://www.nytimes.com/2020/03/07/world/middleeast/lebanon-debt-financial-crisis.html

    https://www.nytimes.com/2019/12/03/world/middleeast/lebanon-protests-corruption.html?action=click&module=RelatedLinks&pgtype=Article

    https://www.theguardian.com/world/2020/mar/07/lebanon-to-default-on-debt-for-first-time-amid-financial-crisis

    https://www.nytimes.com/2020/03/07/world/middleeast/lebanon-debt-financial-crisis.html

    https://www.nytimes.com/2019/10/23/world/middleeast/lebanon-protests.html

    DATA- https://data.worldbank.org/country/lebanon

    https://www.britannica.com/place/Lebanon/Trade

    https://tradingeconomics.com/lebanon/government-debt


    Image Credit: Adobe Stock

  • COVID-19 Challenges for India: Tackling MSME Sector and Unemployment

    COVID-19 Challenges for India: Tackling MSME Sector and Unemployment

    The COVID-19 pandemic has shaken global markets as countries struggle to battle national and global health crisis. Indian government has announced an economic stimulus of  Rupees 20 lakh crore (Rs 20 trillion corresponding to $ 267 billion), roughly 10% of GDP for FY 21, in which six measures were framed for the Micro Small Medium Scale Enterprises (MSME). Government has allocated 3 lakh crore for collateral-free loans, additional debt and equity infusion with slew of other measures to protect the bruised MSME sector. The rise in the number of casualties and infected cases  all over the world present a grim picture. This is expected to result in a global recession that could lead to a loss of over $ 3 trillion to the global GDP. India, in an effort to contain the spread, has extended the lockdown at the cost of freezing almost 60 percent of its economy. Third extension of lockdown on May 3rd in order to flatten the curve will further contract the demand for next few quarters. IMF has revised India’s growth downwards to 1.9 percent for the year 2020 and 7.4 percent for the year 2021. Although the growth projection is not negative as in the cases of Eurozone and the US, India will need to overcome significant structural challenges to bring the economy back into a high growth trajectory. The cost of battling COVID-19 is not limited to the dip in growth but also includes the bleak prospects of a sizable percentage of the population being pushed below the poverty line.

    Apart from the virus, India faces two key challenges. Firstly, almost 80 percent of its labour force is part of the informal sector, which is expected to take major hit as a result of  the lock-down. Secondly, as India’s working age population will continue to expand  till 2055─ the cost of missing this demographic dividend will directly impact the future growth trajectory. Japan, China, South Korea and Singapore have capitalized on their demographic dividends and experienced double digit growths. The current disruption in the global economy will have a significant impact on India’s growth for the next few years. Therefore, diagnosing the systemic problems in the economy is crucial to developing a viable strategic economic policy. The Periodic Labour Force Survey (PLFS) notes that only nine percent of Indian workers are employed with organizations having more than 20 workers. Rest of the labour force are employed with small enterprises which have been forced to lay-off most of their employees due to the extended lockdown.

     Business Supply versus People Demand

    Contributing 30-35 percent of the GDP— Micro, Medium and Small scale industries face a higher risk of shutting down their production due to cash flow constraints. All India Manufacturers association reported that 43 percent of the MSMES will cease to operate with the lockdown extension. Around 99 percent of the MSMEs are dominated by Micro enterprises in which labour intensive production units are already under stress with restricted labour movements. Finance minister’s attempt at redefining MSME by including businesses with higher investment and turnover does not address the main problem of majority of unregistered micro enterprises shutting down due to less or nil operating capital.

    A total of 114 million people are employed in MSMEs and the shortage in working capital as a consequence of the lockdown would drive most businesses out of the market. Furthermore, an extended demand shock would curb the production and supply, as a result of which small industries with limited capital will most likely shut down. Additionally, 86 percent of the enterprises are unregistered and 71 percent of labourers have no written job contracts. Since most of the enterprises function in highly unorganised sectors, they would have been forced to lay off employees.  Thus relevant policies will need to be recalibrated in order to address the problem of unemployment– currently estimated to be 27.11 percent. The share of MSME exports is valued at $147.7 billion– showing an impressive jump from the previous value at $75 billion. The small number of exporting businesseswill be clamped down due to insufficient liquidity especially with weak global demand.  Hence, the policy must focus on balancing to keep the interest rates low in the long run and enhance discretionary spending to boost investors’ confidence. One of the six measures announced by the government is to protect the local MSMEs from unfair foreign competition. Pursuing a protectionist policy in the business sector before the recovery of domestic demand would imply higher risk of the economy being caught in a low demand cycle. Additionally, the recent exemption of labour laws threatens the workers’ income─ reducing the revival rate of consumer demand. According to a latest reading of the consumer demand risk map, casual labourers in both rural and urban areas are at highest risk of salvaging potential expenditure.

    Need to Reorganize MSME and Boost Employment

    Although strong relief packages are demanded, India has limited fiscal space. The slew of measures announced by the central bank to ease the liquidity will cushion the MSME sector during the lockdown period. However, incentivizing small scale businesses to operate amidst weak demand would need recapitalizing finance based on the firm’s productivity. A structural makeover of the business sector will call for measures beyond just monetary policy. While current economic stimulus aims at protecting the business sector, challenges remain in adopting a medium term policy given the unorganized structure. The OECD countries have broadly undertaken measures to reduce the impact on their Small and Medium Enterprises (SMEs) by providing wage subsidies, loan guarantees, direct lending and modified structural policies. The Reserve Bank of India (RBI) has similarly offered a much-needed loan moratorium, cuts in the Cash Reserve Ratio (banks minimum reserve requirement to be held with RBI) and working capital financing. Although the second round of relief package has focused on small industries, the expectation of a burgeoning fiscal deficit to 5.07 percent from revised estimate of 3.8 percent means that financial  stimulus is somewhat of a double edged sword.

    Even prior to the pandemic, unemployment was at a 45 year’s high at 8.5 percent and consumption was on downtrend. The economic response for India must factor in the welfare loss while assessing the economic consequence. In five out of the first ten years of entering its demographic dividend phase, Japan was experiencing double digit growth.  If India is not to lose out on growth momentum during the current stage of its youth bulge, it would require effective and radical policy measures to counter the problem. Economic relief packages during the crisis must be followed with strategies to provide economic security to the working age population across the country.

    To keep up with the growth of the working age population, estimates suggest that India must create 10 million jobs annually. Ease of doing business becomes a crucial factor in creating employment opportunities. Indian policymakers are tasked to identify the methods to sustain the operations of MSME sector post lockdown. The large workforce resulting from India’s youth bulge cannot be undermined by this crisis. Policy prescription to create rapid employment and facilitate business operations is the priority. For India, it is important to endeavour to balance the immediate financial response with continuous public and human capital investment. Biting the fiscal bullet is inevitable in a crisis situation but assessing the cost of growth foregone is crucial to strategize policies for future. The real challenge lies in the transition of role from being protective to promotional through structural operations by factoring in the consumption demand. Temporary infusion of money in businesses and renovation of MSME sector is much needed to realize the ‘Make in India’ dream.

    Image Credit: Adobe Stock