A recent RTI application filed by The Hindu, enquiring into the details of registration applications for breeding African Grey Parrots, has brought alarming revelations to the limelight. Out of 19 States and Union territories, only Kerala has a record of 17 applications for a breeder’s license for African Grey Parrots. All other states had “no access to data”. The African Grey Parrot is listed in the CITES (Convention on International Trade in Endangered Species of Wild Fauna and Flora) Appendix 1 (that is, prohibited for commercial trade). Its IUCN (International Union for Conservation of Nature) status is “Endangered”. Registration and licensing are required to breed or own an African Grey Parrot. We can easily find African Grey Parrots in pet shops and aviaries, yet much of the registration data remains missing.
India, especially Chennai Airport, has recorded the highest seizure of trade in wild and exotic animals. A TRAFFIC study reveals that nearly 70,000 wild animals and their parts were traded from 2011 to 2020. According to the Wildlife Crime Control Bureau, Tigers, Pangolins, Parakeets, Munia, owls, Quails, mynas, Jungle fowls, and partridges are common in local trade. Among species seized at airports, birds were the most common. Considering the negligible information on registrations and licensing for exotic bird trade, this cannot be viewed as a coincidence.
Why are exotic species trade and breeding regulated?
There are four main reasons for these regulations. Firstly, these animals have difficulty adapting to new habitats. Secondly, their population in their home regions are either endangered or vulnerable, and the export of these species only worsens the situation. Thirdly, these species are “invasive” in India. If they are knowingly or unknowingly released into the wild or environment, they may be a threat to the Indigenous species population. Fourthly and most importantly, they are bio-hazardous, since they are carriers of Zoonotic diseases– a fact which cannot be forgotten after the COVID 19 pandemic.
The Policy for Regulation of Import, Breeding and Sale of Exotic Species:
The Wildlife Protection Act, 1972, had regulations on the breeding and sale of species, listed in Schedules I to IV of the Act. These Schedules were not comprehensive and did not include most of the species listed in Appendix 1 of CITES. In June 2020, the Ministry of Environment, Forest and Climate Change (Wildlife Division) published an “Advisory for Dealing with Import of Exotic Live Species in India and Declaration of Stock”. This advisory included a provision for a Voluntary Disclosure Scheme, a move designed to encourage breeders and pet owners to come forward and register the exotic species they were rearing. As an incentive, those who declared their exotic species within six months of receipt of the advisory were not required to produce any documentation. Despite these efforts, only 32,645 individuals from 25 states and five Union Territories declared their possession of exotic species. Reports state that animals like Kangarooswere grown as pets as well.
In 2022, a significant change was made at the legislation level. The Wildlife Protection Act was amended and came into effect on 1st April 2023. The main objective of this amendment was to rationalise the Act in order to implement the provisions of CITES.
In 2023, the Ministry of Environment, Forest and Climate Change notified the Breeders of Species License Rules, 2023under Section 49 N. As per Section 49 N of the Act, a person engaged in breeding in captivity or artificially propagating any scheduled specimen listed in Appendix I of Schedule IV is required to make an application for a license within a period of ninety days of the commencement of the Wild Life (Protection) Amendment Act, 2022. The Breeders of Species License Rules, 2023, mandated that all animals listed in Appendices 1 and 4 may be bred only with a valid license. It also laid down the procedure for license application. As per this rule, July 21, 2023, was set as the deadline to submit a license application to the Chief Wild Life Warden. This application was verified and endorsed by a designated authority. The district forest officials and Wildlife wardens are expected to conduct inspections and submit reports within 30 days of receiving the forms.
The current rules governing exotic species are even simpler. In 2024, under Section 49 M of the Wildlife Protection Act, the Ministry notified the Living Animal Species (Reporting and Registration) Rules, 2024, to facilitate a digital mode of application for licenses. Now, breeders and anyone in possession of exotic species can apply for registration in the PARIVESH 2.0 portal. This had to be done by 28th August 2024, or within 30 days from the date of receipt of such exotic species. The application fee for registration in this portal is Rs. 1,000. If such species were acquired before the enactment of the Wildlife (Protection) Amendment Act, 2022, a declaration had to be submitted. The latest rule mandates the registration of births, transfers, and deaths of these exotic species. Anyone failing to comply with the documents or rules shall have their registration cancelled.
Apart from the above rules that specifically deal with exotic species, the Prevention of Cruelty to Animals (Pet shop) Rules, 2018 also address registration of pet shops, detailed rules on breeding and maintaining all kinds of pets, provisions regarding inspections by animal welfare boards, etc. This rule requires pet shops to maintain registers and submit annual reports to the State Animal Welfare boards. It also states that the import of birds and animals must be carried out with proper registration and approvals.
Therefore, the current rules in place for general pet stores and the conditions for the breeding and sale of pets are addressed by the Prevention of Cruelty to Animals (Pet shop) Rules, 2018, and the State Animal Welfare Board. However, with respect to exotic birds and animals, the Living Animal Species (Reporting and Registration) Rules, 2024 specify the proper channels for registration, breeding, and imports, and state that the State Forest Departments are responsible for maintaining databases of these species. Breeding exotic species requires registration with the PARIVESH 2.0 portal and special permits, such as a No Objection Certificate from the Chief Wildlife Warden and a CITES Breeding license, as prerequisites to apply for import and breeding.
The Ground Realities
Despite these stringent rules, one can often find exotic birds in pet shops, often in caged conditions. A gruelling scene to the eyes is the Pet Market at Chennai Broadway. Many pet traders sell exotic species in an open black market for rates ranging from ₹20,000 to 50,000 for tamed and trained birds and as low as ₹1500-4000 for young chicks. One can find advertisements for these sellers on popular social media platforms such as YouTube and Instagram. They would claim that they have “all papers”, but they usually only hold a DNA test paper that shows the determination of the sex of the bird through these tests. This market is completely unregulated, even with police around. Policemen state that they cannot take action unless they receive a complaint from the State Forest Department or the Animal Welfare Board. The primary issue is the lack of regular inspections of these markets by the State Forest Departments. The 2024 rules state that every registered breeder must be present for inspection of facilities as and when required. In 2024, the Tamil Nadu State Forest Department invited public suggestions on Draft Guidelines on Exotic Species Declaration, the current status of which is unknown.
A significant loophole in the Living Animal Species (Reporting and Registration) Rules, 2024, is that it does not specify remedies or penalties for voluntary or involuntary release of exotic birds into the environment. It does not specify any penalty for unregistered breeding. Additionally, breeders and pet owners lack adequate infrastructure to breed these exotic birds. They are commonly grown as pets in their households.
Way Forward:
It is practically impossible for State Forest Departments to conduct door-to-door inspections for possession of exotic species; however, open black markets need to be curbed. NGOs and animal and wildlife activists must come forward to educate the public on the breeding of exotic species. More voluntary disclosures must be encouraged by activist groups and NGOs. There must be policy-level clarity on unregistered breeding and a remedy for releases into the environment. Departments must step up their database maintenance of registrations, pet locations and their health status in a robust way. A practical way to start is to track current pet owners from pet shop and breeder sales registries – which can be done by Animal Welfare Boards. Data pertaining to exotic species can be handed over to the State Forest Department for further action. The Animal Welfare Board and the State Forest Department must improve interoperability in the training of pet owners, pet shopkeepers, and breeders. To prevent another outbreak of Zoonotic disease or disapproval from international bodies, it remains imperative to prioritise this issue, especially given the rising demand for the domestication of these species.
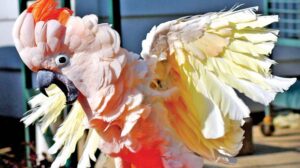
Feature Image Credit: india.com