In 1947, at the time of Independence, India’s socio-economic parameters were similar to those in countries of South East Asia and China. The level of poverty, illiteracy, and inadequacy of health infrastructure was all similar. Since then, these other countries have progressed rapidly leaving India behind in all parameters. ‘Why is it so?’ should be the big question for every Indian citizen in this time of our 75th anniversary celebrations.
Introduction
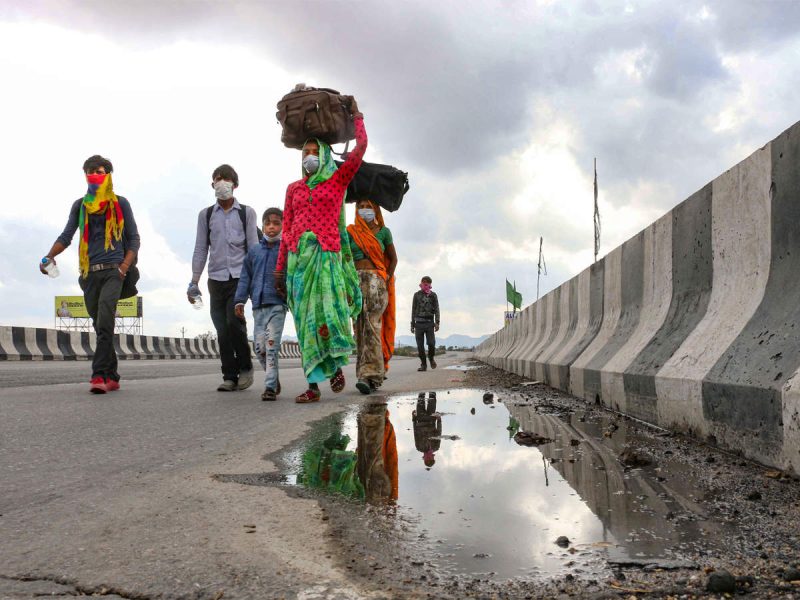
India at 75 is a mixed bag of development and missed opportunities. The country has achieved much since Independence but a lot remains to be done to become a developed society. The pandemic has exposed India’s deficiencies in stark terms. The uncivilized conditions of living of a vast majority of the citizens became apparent. According to a report by Azim Premji University, 90% of the workers said during the lockdown that they did not have enough savings to buy one week of essentials. This led to the mass migration of millions of people, in trying conditions from cities to the villages, in the hope of access to food and survival.
Generally, technology-related sectors, pharmaceuticals and some producing essentials in the organized sectors have done well in spite of the pandemic. So, a part of the economy is doing well in spite of adversity but incomes of at least 60% of people at the bottom of the income ladder have declined (PRICE Survey, 2022). The great divide between the unorganized and organized parts of the economy is growing. The backdrop to these developments is briefly presented below.
Structure and Growth of the Economy
In 1947, at the time of Independence, India’s socio-economic parameters were similar to those in countries of South East Asia and China. The level of poverty, illiteracy, and inadequacy of health infrastructure was all similar. Since then, these other countries have progressed rapidly leaving India behind in all parameters. So, India has fallen behind relatively in spite of improvements in health services and education, diversification of the economy and development of the industry.
In 1950, agriculture was the dominant sector with a 55% share of GDP which has now dwindled to about 14%. The share of the services sector has grown rapidly and by 1980 it surpassed the share of agriculture and now it is about 55% of GDP. The Indian economy has diversified production `from pins to space ships’.
Agriculture grows at a trend rate of a maximum of 4% per annum while the services sector can grow at even 12% per annum. So, there has been a shift in the economy’s composition from agriculture to services, accelerating the growth rate. The average growth rate of the economy between the 1950s and the 1970s was around 3.5%. In the 1980s and 1990s, it increased to 5.4% due to the shift in the composition. There was no acceleration in the growth rate of the economy in the 1990s compared to the 1980s. This rate again increased in the period after 2003 only to decline in 2008-09 due to the global financial crisis. Subsequently, the rate of growth has fluctuated wildly both due to global events and the policy conundrums in India.
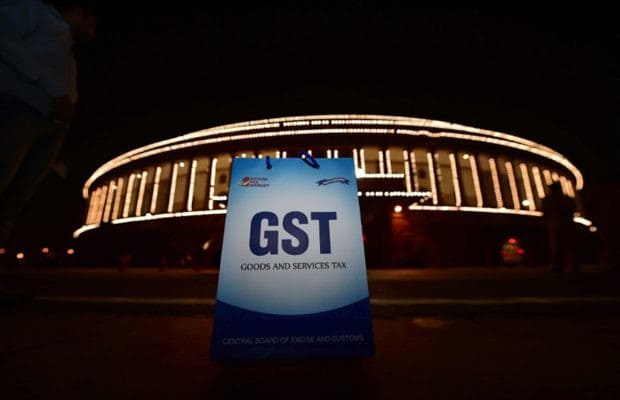
There was the taper tantrum in 2012-13 which cut short the post-global financial crisis recovery. Demonetization in November 2016 adversely impacted growth. That was followed by the structurally flawed GST. These policies administered shocks to the economy. Then came the pandemic in 2020. The economy’s quarterly growth rate had already fallen from 8% in Q4 2017-18 to 3.1% in Q4 2019-20, just before the pandemic hit.
1980-81 marked a turning point. Prior to that, a drought would lead to a negative rate of growth in agriculture and of the economy as a whole. For instance, due to the drought in 1979-80, the economy declined by 6%. But, that was the last one. After that, a decline in agriculture has not resulted in a negative growth rate for the economy. The big drought of 1987-88 saw the economy grow at 3.4%. After 1980-81, the economy experienced a negative growth rate only during the pandemic which severely impacted the services sector, especially the contact services.
Employment and Technology Related Issues
Agriculture employs 45% of the workforce though its share in the economy (14%) has now become marginal. It has been undergoing mechanisation with increased use of tractors, harvester combines, etc., leading to the displacement of labour. Similar is the case in non-agriculture. So, surplus labour is stuck in agriculture leading to massive disguised unemployment.
India is characterized by disguised unemployment and underemployment.Recent data points to growing unemployment among the educated youth. They wait for suitable work. The result is a low labour force participation rate (LFPR) in India (in the mid-40s) compared to similar other countries (60% plus).The gender dimension of unemployment and the low LFPR is worrying with women the worst sufferers.
India’s employment data is suspect. The reason is that in the absence of unemployment allowance, people who lose work have to do some alternative work otherwise they would starve. They drive a rickshaw, push a cart, carry a head load or sell something at the roadside. This gets counted as employment even though they have only a few hours of work and are underemployed. So, India is characterized by disguised unemployment and underemployment.
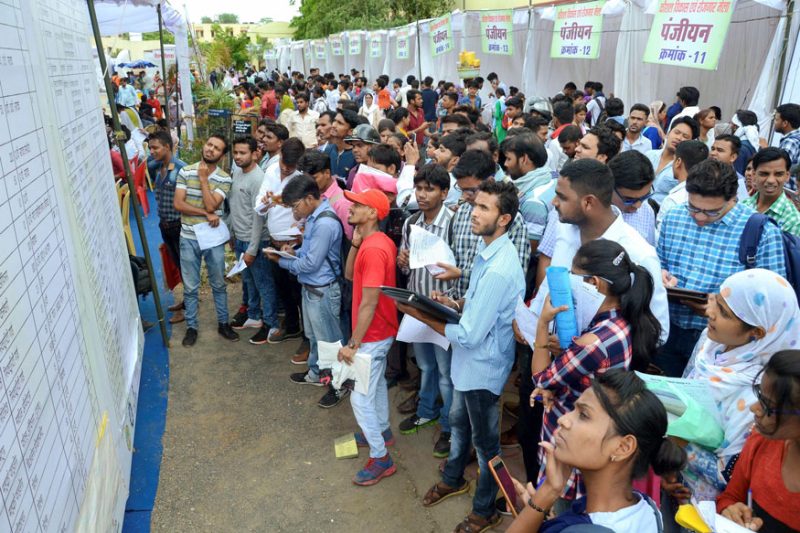
Recent data points to growing unemployment among the educated youth. They wait for suitable work. The result is a low labour force participation rate (LFPR) in India (in the mid-40s) compared to similar other countries (60% plus). It implies that in India maybe 20% of those who could work have stopped looking for work. No wonder for a few hundred low-grade government jobs, millions of young apply. The gender dimension of unemployment and the low LFPR is worrying with women the worst sufferers.
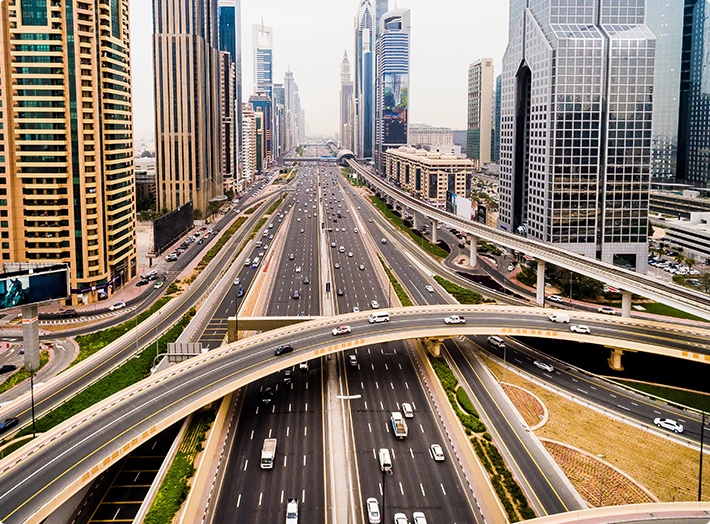
These aspects of inadequate employment generation are linked to automation and the investment pattern in the economy. New technologies that are now being used in the modern sectors are labour displacing. For instance, earlier in big infrastructure projects like the construction of roads, one could see hundreds of people working but now big machines are used along with a few workers.
Further, the organized sectors get most of the investment so little is left for the unorganized sector. This is especially true for agriculture. Thus, neither the organized sector nor agriculture is generating more work. Consequently, entrants to the job market are mostly forced to join the non-agriculture unorganized sector, which in a sense is the residual sector, where the wages are a fraction of the wages in the organized sector. The unorganized sector also acts as a reserve army of labour keeping organized sector wages in check
Lack of a Living Wage
To boost profits, the organized sector is increasingly, employing contract labour rather than permanent employees. This is true in both the public and private sectors. So, not only the workers in the unorganized sector, even the workers in the organised sector do not earn a living wage. Thus, most workers have little savings to deal with any crisis. They are unable to give their children a proper education and cannot afford proper health facilities. Most of the children drop out of school and can only do menial jobs requiring physical labour. They cannot obtain a better-paying job and will remain poor for the rest of their lives.
The Delhi socio-economic survey of 2018 pointed to the low purchasing power of the majority of Indians. It showed that in Delhi, 90% of households spent less than Rs. 25,000 per month, and 98% spent less than Rs. 50,000 per month. Since Delhi’s per capita income is 2.5 times the all India average, deflating the Delhi figures by this factor will approximately yield all India figures. So, 98 per cent of the families would have spent less than Rs.20,000 per month, and 90 per cent less than Rs.10,000 per month. This effectively implies that 90 per cent of families were poor in 2018, if not extremely poor (implied by the poverty line). During the pandemic, many of them lost incomes and were pauperized and forced to further reduce their consumption.
Unorganized Sector Invisibilized
In the unorganized sector, labour is not organized as a trade union and therefore, is unable to bargain for higher wages, when prices rise. It constitutes 94% of the workforce and has little social security. No other major world economy has such a huge unorganized sector. No wonder when such a large section of the population faces a crisis in their lives, the economy declines, as witnessed during the pandemic. India’s official rate of growth fell more sharply than that of any other G20 country.
The micro sector has 99% of the units and 97.5% of the employment of MSME and is unlike the small and medium sectors. The benefits of policies made for the MSME sector do not accrue to the micro units.
Policymakers largely ignore the unorganized sector. The sudden implementation of the lockdown which put this sector in a deep existential crisis points to that. The micro sector has 99% of the units and 97.5% of the employment of MSME and is unlike the small and medium sectors. The benefits of policies made for the MSME sector do not accrue to the micro units.
Invisibilization of the unorganized sector in the data is at the root of the problem. Data on this sector become available periodically, called the reference years. In between, it is assumed that this sector can be proxied by the organized sector. This could be taken to be correct when there is no shock to the economy and its parameters remain unchanged.
Demonetization and the flawed GST administered big shocks to the economy and undermined the unorganized sector. Its link with the organized sector got disrupted. Thus, the methodology of calculating national income announced in 2015 became invalid.
The implication is that the unorganized sector’s decline since 2016 is not captured in the data. Worse, the growth of the organized sector has been at the expense of the unorganized sector because demand shifted from the latter to the former. It suited the policymakers to continue using the faulty data since that presented a rosy picture of the economy. This also lulled them into believing that they did not need to do anything special to check the decline of the unorganized sector.
Policy Paradigm Shift in 1947
Growing unemployment, weak socio-economic conditions, etc., are not sudden developments. Their root lies in the policy paradigm adopted since independence.
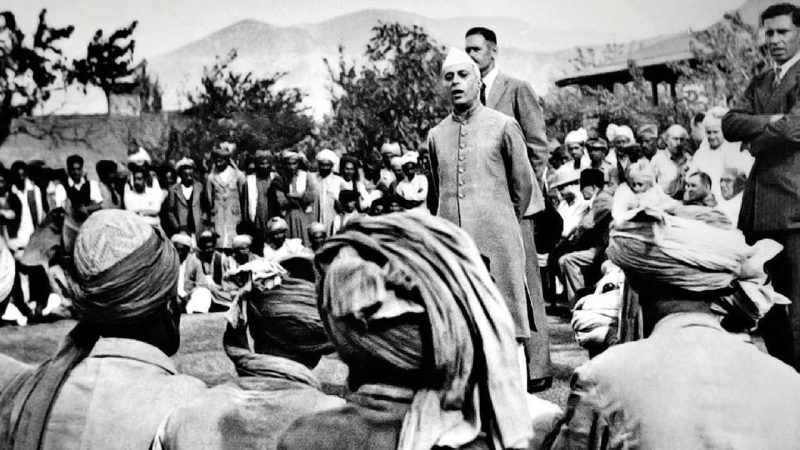
In 1947, the leadership, influenced by the national movement understood that people were not to blame for their problems of poverty, illiteracy and ill-health and could not resolve them on their own. So, it was accepted that in independent India these issues would be dealt with collectively. Therefore, the government was given the responsibility of tackling these issues and given a key role in the economy.
Simultaneously, the leadership, largely belonging to the country’s elite, was enamoured of Western modernity and wanted to copy it to make India an ’advanced country’. The two paths of Western development then available were the free market and Soviet-style central planning. India adopted a mix of the two with the leading role given to the public sector. This path was chosen also for strategic reasons and access to technology which the West was reluctant to supply. But, this choice also led to a dilemma for the Indian elite. It had to ally with the Soviet Union for reasons of defence and access to technology but wanted to be like Western Europe.
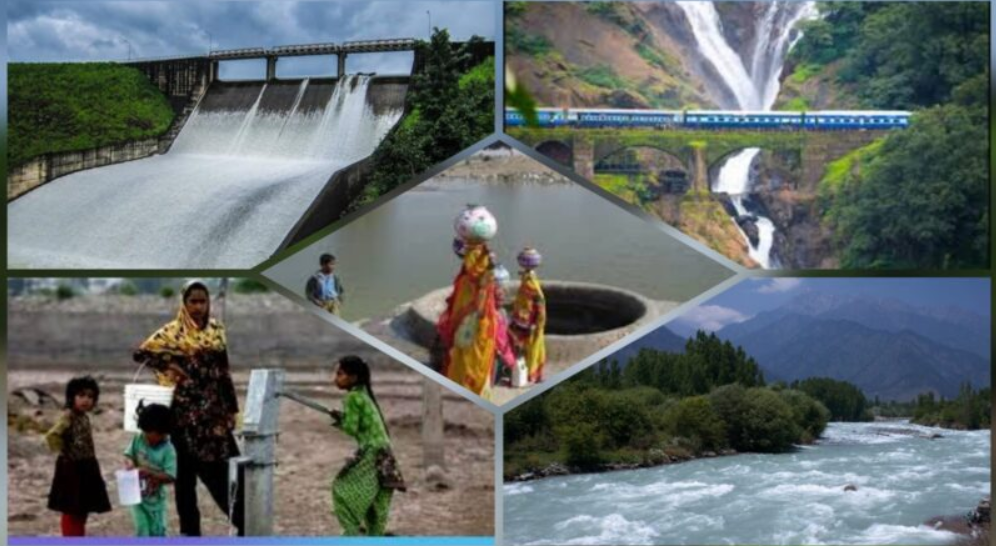
Both the chosen paths were based on a top-down approach. The assumption was that there would be a trickle down to those at the bottom. People accepted this proposition believing in the wider good of all. Resources were mobilized and investments were made in the creation of big dams and factories (called temples of modern India) that generated few jobs. They not only displaced many people trickle down was minimal. For instance, education spread but mostly benefitted the well-off.
The Indian economy diversified and grew rapidly. An economy that for 50 years had been growing at about 0.75% grew at about 4% in the 1950s. But, the decline in the death rate led to a spurt in the rate of population growth. So, the per capita income did not show commensurate growth, and poverty persisted. Problems got magnified due to the shortage of food following the drought of 1965-67 and the Wars in 1962 and 1965. The Naxalite movement started in 1967, there was BOP crisis and high inflation in 1972-74 due to the growing energy dependence and the Yom Kippur war. Soon thereafter there was political instability and the imposition of an Emergency in 1975. The country went from crisis to crisis.
Planning failed due to crony capitalism. The prevailing political economy enabled the business community to systematically undermine policies for their narrow ends by fueling the growth of the black economy.
The failure of trickle-down and the cornering of the gains of development by a narrow section of people led to growing inequality and people losing faith in the development process. Different sections of the population realized that they needed a share in power to deliver to their group. Every division in society — caste, region, community, etc. — was exploited. The leadership became short-termist and indulged in competitive populism by promising immediate gains.
The consensus on policies that existed at independence dissipated quickly. Election time promises to get votes were not fulfilled. For instance, PM Morarji Desai said that promises in the Janata Dal manifesto in 1977 were the party’s programme and not the government’s. Such undermining of accountability of the political process has undermined democracy and trust and aggravated alienation.
Black Economy and Policy Failure
The black economy has grown rapidly since the 1950s with political, social and economic ramifications. Even though it is at the root of the major problems confronting the country, most analysts ignore it.
So, the black economy controls politics and to retain power it undermines accountability and weakens democracy.
It undermines elections and strengthens the hold of vested interests on political parties. The compromised leadership of political parties is open to blackmail both by foreign interests and those in power. When in power it is willing to do the bidding of the vested interests. So, the black economy controls politics and to retain power it undermines accountability and weakens democracy.
The black economy controls politics and corrupts it to perpetuate itself. The honest and the idealist soon are corrupted as happened with the leadership that emerged from the anti-corruption JP movement in the mid-1970s. Many of them who gained power in the 1990s was accused of corruption and even prosecuted. Proposals for state funding of elections will only provide additional funds but not help clean up politics.
The black economy can be characterized as ’digging holes and filling them’. It results in two incomes but zero output. There is activity without productivity with investment going to waste. Consequently, the economy grows less than its potential. It has been shown that the economy has been losing 5% growth since the mid-1970s. So, if the black economy had not existed, today the economy could have been 8 times larger and each person would have been that much better off. Thus, development is set back. In 1988, PM Rajiv Gandhi lamented that out of every rupee sent only 15 paisa reaches the ground. P Chidambaram as FM said, `expenditures don’t lead to outcomes’.
The black economy leads to the twin problem of development. First, black incomes being outside the tax net reduce resource availability to the government. If the black incomes currently estimated at above 60% of GDP could be brought into the tax net, the tax/GDP ratio could rise by 24%. This ratio is around 17% now and is one of the lowest in the world. Further, as direct tax collections rise, the regressive indirect taxes could be reduced, lowering inflation.
India’s fiscal crisis would also get resolved. The current public sector deficit of about 14% would become a surplus of 10%. This would eliminate borrowings and reduce the massive interest payments (the largest single item in the revenue budget). It would enable an increase in allocations to public education and health to international levels and to infrastructure and employment generation.
In brief, curbing the black economy would take care of India’s various developmental problems, whether it be lack of trickle-down, poverty, inequality, policy failure, employment generation, inflation and so on. It causes delays in decision-making and a breakdown of trust in society.
Due to various misconceptions about the black economy, many of the steps taken to curb it have been counterproductive, like demonetization. Dozens of committees and commissions have analysed the issues and suggested hundreds of steps to tackle the problem. Many of them have been implemented, like reduction in tax rates and elimination of most controls but the size of the black economy has grown because of a lack of political will.
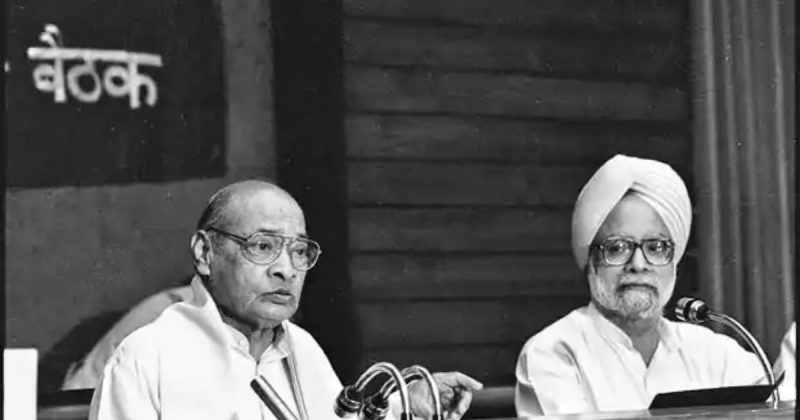
Policy Paradigm Shift in 1991
Failure of policies led to crisis after crisis in the period leading up to 1990. The blame was put on the policies themselves and not the crony capitalism and black economy that led to their failure. The policies prior to 1990 have been often labelled as socialist. Actually, the mixed economy model was designed to promote capitalism. At best the policies may be labelled as state capitalist and they succeeded in their goal. Private capital accumulated rapidly pre-1990. The Iraq crisis of 1989-90 led to India’s BOP crisis and became the trigger for a paradigm change in policies in favour of capital. The earlier more humane and less unequal path of development was discarded.
Marketization has led to the ’marginalization of the marginals’, greater inequality and a rise in unemployment.
In 1991, a new policy paradigm was ushered in. Namely, ’individuals are responsible for their problems and not the collective’. Under this regime, the government’s role in the economy was scaled back and individuals were expected to go to the market for resolving their problems. This may be characterized as ’marketization’. This brought about a philosophical shift in the thinking of individuals and society.
Marketization has led to the ’marginalization of the marginals’, greater inequality and a rise in unemployment. These policies have promoted ’growth at any cost’ with the cost falling on the marginalized sections and the environment, both of which make poverty more entrenched. So, the pre-existing problems of Indian society have got aggravated in a changed form.
Poverty is defined in terms of the ’social minimum necessary consumption’ which changes with space and time. Marketization has changed the minimum due to the promotion of consumerism and environmental decay imposing heavy health costs.
The highly iniquitous NEP is leading to an unstable development environment. The base of growth has been getting narrower leading to periodic crises. Additionally, policy-induced challenges like demonetization, GST, pandemic and now the war in Ukraine have aggravated the situation. These social and political challenges can only grow over time as divisions in society become sharper.
Weakness in Knowledge Generation
Why does the obvious not happen in India? No one disagrees that poverty, illiteracy and ill health need to be eliminated. In addition to the problems due to the black economy and top-down approach, India has lagged behind in generating socially relevant knowledge to tackle its problems and make society dynamic.
Technology has rapidly changed since the end of the Second World War. It is a moving frontier since newer technologies emerge leading to constant change and the inability of the citizens to cope with it. The advanced technology of the 1950s is intermediate or low technology today.
Literacy needs to be redefined as the ability to absorb the current technology so as to get a decent job. Many routine jobs are likely to disappear soon, like, driver’s jobs as autonomous (self-driving) vehicles appear on the scene. Most banking is already possible through net banking and machines, like, ATMs. Banks themselves are under threat from digital currency.
So, education is no more about the joy of learning and expanding one’s horizon. No wonder, the scientific temper is missing among a large number of the citizens.
India’s weakness in knowledge generation is linked to the low priority given to education and R&D. Learning is based substantially on `rote learning’ which does not enable absorption of knowledge and its further development. So, education is no more about the joy of learning and expanding one’s horizon. No wonder, the scientific temper is missing among a large number of the citizens. Dogmas, misconceptions and irrationalities rule the minds of many and they are easily misled. This is politically, socially and economically a recipe for persisting backwardness.
In spite of policy initiatives regarding education, like, the national education policy in 1968 and 1986, there is deterioration. This is because the milieu of education is all wrong. Policy is in the hands of bureaucrats, politicians or academics with bureaucratized mindsets. So, policies are mechanically framed. Like the idea that ’standards can be achieved via standardization’.
Learning requires democratization. So, institutions need to be freed from the present feudal and bureaucratic control. Presently, institutions treat dissent as a malaise to be eliminated rather than celebrated. Courses are sought to be copied from foreign universities. JNU is told to be like Harvard or Cambridge. This is a contradiction in terms; originality cannot be copied. Courses copied from abroad tend to be based on the societal conditions there and not Indian conditions. Gandhi had said that the Indian education system is alienating and for many it still is.
The best minds mostly go abroad and even if they return, they bring with them an alien framework not suited to India. So, as a society, we need to value ideas, prioritize education and R&D and generate socially relevant knowledge.
Learning is given low priority because ideas are sought to be borrowed from abroad. So, the rulers have little value for institutions that could generate new ideas and inadequate funds are allotted to them. The best minds mostly go abroad and even if they return, they bring with them an alien framework not suited to India. So, as a society, we need to value ideas, prioritize education and R&D and generate socially relevant knowledge.
Conclusion
The growth at any cost strategy has been at the expense of the workers and the environment. This has narrowed the base of growth and led to instability in society — politically, socially and economically.
India is a diverse society and the Indian economy is more complex than any other in the world. This has posed serious challenges to development in the last 75 years but undeniably things are not what they were. The big mistake has been to choose trickle-down policies that have not delivered to a vast number of people who live in uncivilized conditions. Poverty has changed its form and the elite imply that the poor should be grateful for what they have got. They should not focus on growing inequality, especially after 1991, when globalization entered the marketization phase which marginalizes the marginals.
The growth at any cost strategy has been at the expense of the workers and the environment. This has narrowed the base of growth and led to instability in society — politically, socially and economically. The situation has been aggravated by the recent policy mistakes — demonetization, flawed GST and sudden lockdown. The current war in Ukraine is likely to lead to a new global order which will add to the challenges. The answer to ’why does the obvious not happen’ in India is not just economic but societal. Unless that challenge is met, portents are not bright for India at 75.
This paper is based substantially on, `Indian Economy since Independence: Persisting Colonial Disruption’, Vision Books, 2013 and `Indian Economy’s Greatest Crisis: Impact of Coronavirus and the Road Ahead’, Penguin Random House, 2020.
This article was published earlier in Mainstream Weekly.
Feature Image Credit: Financial Express
Other Images: DNA India, news18.com, economictimes, rvcj.com