Category: Economy & Development

  • GM insect-resistant Bt cotton boosted India’s crop yields? Differing Experts

    GM insect-resistant Bt cotton boosted India’s crop yields? Differing Experts

    India was the world’s leading cotton and textile producer for millenniums. In the 1990s the traditional ‘desi’ variety of cotton was upstaged by imported hybrid cotton varities in the hopes of increased production and profits. They soon became vulnerable to pests and resulted in increased use of fertilisers and pesticides, thus increasing the production costs. The failure of hubrid cotton led to the introduction of Bt cotton in 2002 as India’s first genetically modified crop. GM crops have been strongly opposed by increasing believers of traditional agriculture and scientists, possibly for very good reasons. India’s cotton production has quadrupled by 2010 and proponents of GM crops have attributed this to Bt cotton. This has been hotly contested. The recent assertion in favour of Bt cotton by Dr Ramesh Chander of Niti Aayog, early this year, has come under scathing criticism in an article by Professor Andrew Paul Gutierrez, Dr. Hans R.Herren, and Dr. Peter E.Kenmore  as also by Sujatha Byravan. The claims by the advocates of GM crops and Bt cotton were questioned in a well-researched article early this year by scientists K R Kranthi and G D Stone. This article counters their arguements.

                                                                                                                                                                                                        – TPF
    This article was originally posted on the non-profit GeneticLiteracyProject.org website.

    Authors: Cameron English, Jon Entine, and Matin Qaim

    Was the introduction of transgenic (GMO) cotton seeds to India in 2002 the beginning of the renaissance of the country’s then struggling cotton industry? Or was it a non-event, hyped by biotechnology advocates, especially agro-businesses, to bolster the case for a technology struggling for public acceptance?

    After years of farmers losing crops to tobacco budworms, cotton bollworms and pink bollworms, costing billions of dollars a year in losses, Monsanto developed insect-resistant Bt cotton in the early 1990s. The engineered crop has become widespread since its commercial release in China and the United States in 1996, followed by its introduction to India in 2002.

    Within just a few years, India’s troubled cotton industry had done a 180, emerging as one of the world’s largest producers of GMO cotton, as exports boomed, helping to fuel India’s rapid rise as an emerging nation. But not everyone accepts this version of events. Agricultural biotechnology critics maintain that the success of Bt cotton was more smoke and mirrors than science, a story deceptively promoted by the beleaguered agricultural biotechnology industry and its supporters

    Competing research conclusions

    The Bt cotton debate was reignited this year following the publication of contrasting scholarly analyses, one challenging the success narrative and several others defending it. The latest volley of criticism was launched in March when Indian entomologist K. R. Kranthi and Washington University anthropologist Glenn Davis Stone wrote a scathing analysis of Bt cotton success claims in Nature Plants, an article widely disseminated by the global media. Reviewing 20 years of data, the authors claimed that the dramatic success of India’s first (and only) GMO crop was largely hype, and may have even been a failure. According to Stone in a press release put out by Washington University in St. Louis:

    Yields in all crops [in India] jumped in 2003, but the increase was especially large in cotton,” Stone said. “But Bt cotton had virtually no effect on the rise in cotton yields because it accounted for less than 5% of India’s cotton crop at the time.
    Now farmers in India are spending more on seeds, more on fertilizer and more on insecticides …. Our conclusion is that Bt cotton’s primary impact on agriculture will be its role in making farming more capital-intensive — rather than any enduring agronomic benefits.

    That led to a rebuke by long-time scholars in the field. In early May, four scientists at the South East Asia Biotechnology Center in New Dehli weighed in with their own take down in the open access Cold Spring Harbor Laboratory Publication bioRxiv, concluding:

    This study [Kranthi and Stone] conspicuously ignores positive shifts that occurred with Bt adoption at reduced real cost of production in all states resulting in large welfare benefits netting out increased cost of cultivation. [The fallacy] associated with increasing yield trends even before [the] introduction of Bt cotton as claimed by Kranthi and Stone does not stand [up to] scrutiny of increasing yield trends from 2002-03 to 2009-10, with some years showing significant yield dips due to drought [only] to bounce back …. in 2017-18. The ignorance of drought impact tends to attribute the yield reduction entirely [to] the failure of Bt technology.

    In June, GLP published a detailed critique by plant geneticist Deepak Pental, who wrote:

    The article’s authors claim to have carried out ‘a new analysis of unprecedented scope, time depth and detail’ on cotton cultivation in India to find the real reasons behind the doubling of yields between 2000 and 2006, followed by yield stagnation. While the avowed goal of the analysis is to set the record right on the contribution of the Bt trait to cotton cultivation in India, the real purpose of the report is to cast doubts on the utility of GE technologies.

    Most recently, a number of scientists who have crunched the data responded sharply to the Stone-Kranthi hypothesis in letters published in Nature Plants. One of the most prominent is Ian Plewis, an emeritus professor at the University of Manchester in England, who has written extensively on debunked claims that the introduction of Bt cotton led to a surge in farmer suicides in India. Last year, he analyzed much of the same data cited by Stone and Kranthi in a paper in the Review of Agrarian Studies, arriving at a much more nuanced conclusion.

    The conclusions from these analyses are mixed. The more expensive Bt hybrid seeds have lowered insecticide costs in all three States, but only in Rajasthan did yields increase. An important message of this paper is that conclusions about the effectiveness of Bt cotton are more nuanced than many researchers and commentators recognise. The paper does not refute the assertions about the success of Bt cotton, but it does show that the benefits are not evenly distributed across India.

    In a letter to the journal, Plewis  challenged Kranthi’s and Stone’s methodology.

    Kranthi and Stone do not present state-wide analyses of insecticide use, relying instead on unpublished market research data for India as a whole. Their assertion that farmers are spending more on insecticide than they were before the introduction of Bt is not supported by my analyses which are based on publicly available data and show that the technology reduced the proportion of farmers’ costs going to insecticides in all three states.
    Kranthi and Stone make some important points but their approach prevents them from reaching soundly based assessments of the long-term impacts of Bt cotton on Indian farmers in different states.

    Other critics were equally challenging of their data. In a letter originally published in Nature Plants, agricultural economist Matin Qaim, who has been writing about the impacts of Bt cotton in India since its introduction, jumped into the fray:

    Kranthi and Stone’s attempt to analyze long-term effects of Bt cotton is laudable, as the effects of the technology can change over time due to evolving pest populations and other dynamics. However, their claim that Bt contributed little to the yield increases observed in India between 2002 and 2008 is unconvincing ….

    Strong arguments on both sides. What do the facts say? Let’s separate the cotton from the sharp ends of the boll.

    What is Bt cotton?

    Bt seeds produce over 200 different Bt toxins, each harmful to different insects. Bt cotton is an insect-resistant transgenic crop (GMO) designed to combat many destructive insects, most notably the bollworm. It was created by genetically altering the cotton genome to express a natural, non-pathogenic microbial protein from the bacterium Bacillus thuringiensis that is found in the soil. Bt in its natural and transgenic forms has been extensively evaluated and found to be safe to all higher animals tested. Bt has been used as an insecticide in organic farming since the middle of the 20th century.

    Screen Shot at PM
    Bollworm resistance to Bt cotton problematic for farmers worldwide.

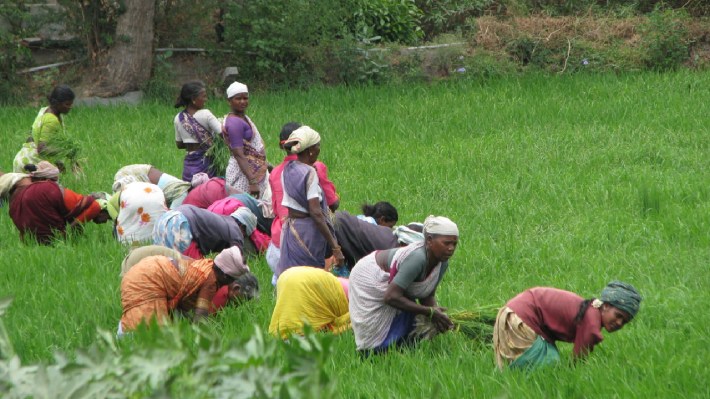
    Traditionally, pesticides have been used to combat the cotton bollworm. However, in developing nations like India, the expense of using large amounts of pesticide is often too high for marginal farmers. Bt cotton was developed with the intention of reducing the amount of pesticide needed for cotton cultivation, thereby reducing production costs for farmers, environmental impact, and the pesticide exposure of applicators, often women and children.

    Numerous independent studies have attributed anywhere from 14-30% of the cotton yield increase in India to the cultivation of Bt seeds. Five years after the introduction of Bt cotton, a professor at Jawaharlal Nehru University and visiting fellow at Centre de Sciences Humaines, New Delhi would write in the Wall Street Journal about India’s recently flagging cotton production: “By 2007-08, India became the largest producer of cotton with the largest acreage under Bt cotton in the world, pushing China into second place.” Many scientists and news organizations cited the surge in production of Indian cotton as one of the clearest GMO success stories.

    After its introduction, within a decade, Bt cotton accounted for more than 95% of all cotton cultivation in India, as yields increased.

    zjoyqkdyts
    During that same period marking a 55% rise in yields, overall use of insecticides remained below absolute levels from 2003, while per- hectare usage dropped precipitously.

    chart
    Source: KR Kranthi (December 2016), News reports from Reuters, Financial Express

    Stone’s critique and pink bollworm resistance

    Despite its initial success, Bt cotton seed is more costly than non-transgenic (but lower yielding) varieties, making it a target for some critics who are skeptical of crop biotechnology. One of those longtime skeptics is Washington University professor Stone. Stone is part of a cohort of scholars and activists, including Indian-philosopher Vandana Shiva, which fervently believes that the Indian Green Revolution that dramatically reduced hunger and is credited with saving more than a billion lives was a failure.

    As far back as 2012, Stone challenged a plethora of studies generally supporting the view behind the success of India’s Bt cotton crops and the resurrection of the nation’s once-threatened cotton industry. Stone looked at the data from a cultural anthropology perspective and saw more hype than substance. Writing in his influential paper in 2012, “Constructing Facts: Bt Cotton Narratives in India,” Stone maintained, “We simply cannot say how Bt seed has affected cotton production in India.”  The “triumph narrative” of Bt cotton in India, he claimed, “flows mainly from economists and the biotech industry (and its academic allies)” in “industry-journal authentication systems” (peer-reviewed journals), which “serve the interests of their constituent parties.” The arrangement is a “cosy alliance between GM manufacturers and ostensibly independent researchers,” he added.

    Problems emerged in 2017, as the pink bollworm ravaged cotton crops in India, suggesting the pest had developed resistance. A January 2018 study released by Central Institute of Cotton Research (CICR) showed how the proportion of pink bollworm on green bolls of Bt cotton plants in Maharashtra, Gujarat and Madhya Pradesh rose from 5.71 percent in 2010 to 73.82 percent in 2017. GMO-skeptic Stone tweeted a link to a scathing article in Bloomberg, sarcastically asking why GMO supporters seemed to be ignoring the Bt’s failure in India.screen shot at pm

    As reporter Mark Lynas noted in an analysis for the Cornell Alliance for Science, the debate is nuanced than either pro or anti factions often maintain. The Bloomberg report did notice that similar problems have not turned up in Australia and China, where Bt cotton is grown, suggesting the resistance may be unique to conditions in India. Lynas interviewed Ronald Herring, author of numerous peer-reviewed papers on the impacts of Bt cotton in India. He acknowledged the reality of the problem, but suggested the issue was murky. The problem could be linked to a variety of issues, including the use of counterfeit Bt seeds, which are rampant in India, or the fact that many financially-pressed Indian farmers abandoned the recommended rotations of a second crop, which can be less profitable than the cash-crop cotton.

    Bt cotton has had an up and down history in India. From 2002 to 2009, cotton production, productivity and acreage grew steadily. Soon, the pink bollworm began developing resistance. Studies between 2013 and 2015 of Indian Council of Agricultural Research and CICR concluded that pink bollworm had developed resistance to Bollgard-II. Insecticide use shot up to levels not seen in a decade.

    Vijay Paranjape, the associate director of the USAID-funded Bt brinjal project in Bangladesh, and an expert in Bt cotton in India, told Lynas that the problem was largely focused in one region, Vidarbha. “[T]here is some pattern to it that could be due to [poor] agronomic practices being followed,” in that area. In other words, the facts are complicated.

    Another Bt expert, Srinivasan Ramasamy, then a visiting scientist at Cornell University, told Lynas: “I don’t agree that Bt cotton has failed in India.” Ramasamy, he said, pointed out that Bt cotton “was developed against three different bollworms — Helicoverpa armigeraEarias spp. and Pectinophora gossypiella” (the latter is pink bollworm).

    Bt cotton effectively reduced these bollworms, except the pink bollworm, that too in Maharashtra only. If the other two species remained as a major threat, the pesticide use might have been several-folds higher than the current use. Hence, Bt cotton has contributed to pesticide reduction.

    Stone’s disputations and Qaim’s response

    This nuanced history of course is often not reflected in the commentaries, or even academic studies, by supporters of GMO crops. Setbacks are often portrayed by hardened critics as absolute failures.

    Jump to 2020, and Stone, joined by K. R. Kranthi, the former director of India’s Central Institute for Cotton Research and now the head of a technical division at the Washington-based International Cotton Advisory Committee, reemerged as a sharp critic of Bt cotton—though the success narrative appears even stronger now. Since 2012, water usage has dropped sharply in Indian while Bt cotton yields have continued to climb, and are at or near historic highs, up more than 150% since the early 2000s.
    f large

    Despite these numbers, Kranthi and Stone argued that “the largest production gains came prior to widespread [Bt] seed adoption and must be viewed in line with changes in fertilization practices and other pest population dynamics.” They also cited the pink bollworm’s evolved resistance to Bt insecticide and the threat posed by other pests that are impervious to the insecticidal power of Bt cotton.

    Qaim found these arguments lacking, however. Building on previous scholarship, the agricultural economist explains that, when other relevant factors are accounted for, Bt cotton did indeed boost crop yields in India. Here are his conclusions:

    The agronomic and socioeconomic effects of insect-resistant Bacillus thuringiensis (Bt) cotton in India have long been debated. In their recent Perspective article, Kranthi and Stone [1] used 20 years of data to analyze associations between the adoption of Bt cotton, crop yields and insecticide use, claiming that Bt technology had little yield effects and did not produce any enduring benefits.

    Here, I argue that the methods used by Kranthi and Stone are not suitable to make statements about causal effects, so their conclusions are misleading. As earlier studies showed [2–7], Bt cotton has contributed to sizeable yield gains and important benefits for cotton farmers and the environment. Kranthi and Stone’s attempt to analyze long-term effects of Bt cotton is laudable, as the effects of the technology can change over time due to evolving pest populations and other dynamics.

    However, their claim that Bt contributed little to the yield increases observed in India between 2002 and 2008 is unconvincing, as this part of their analysis looks at the same time period that was also analyzed previously by other authors with more precise microlevel data and better methodologies [7,8]. Kranthi and Stone use simple graphical analysis to compare time trends for Bt adoption, fertilizer use and yield at national and state levels.

    Comparing the graphs, they find a stronger correspondence between the fertilizer and yield trends than between the Bt adoption and yield trends. Thus, they conclude that the observed yield increases were primarily due to the higher use of fertilizer and other inputs, and not to Bt technology. The problem is that such a simple graphical comparison of time trends is inappropriate to analyze causal effects. Crop yields may increase because of more fertilizer or because of better pest control through the adoption of insect-resistant Bt varieties. It is also possible that some farmers decided to use more fertilizer because of Bt adoption. Many other factors, such as changes in irrigation, other inputs and technologies, agronomic practices, training of farmers or simple weather fluctuations may also affect cotton yields and broader socioeconomic benefits.

    In principle, Kranthi and Stone acknowledge these complexities but they do nothing to control for any of the confounding factors. Previous studies used microlevel data and more sophisticated statistical techniques to control for confounding factors and possible bias, hence leading to more reliable effect estimates. Kathage and Qaim [7] used panel data collected between 2002 and 2008 from over 500 randomly selected cotton farms in four states of India. They used statistical differencing techniques and controlled for the use of fertilizer, irrigation, pesticides, agronomic practices and many other factors, including location and time trends, to deal with selection bias and cultivation bias.

    screenshot bt cotton yields and farmers benefits qaim natureplants pdf

    Results showed that—after controlling for all other factors—Bt adoption had increased cotton yields by 24%, farmers’ profits by 50% and farm household living standards by 18%, with no indication that the benefits were fading during the 2002–2008 period. The same data also revealed that chemical insecticide quantities declined by more than 40% through Bt adop-tion, with the largest reductions in the most toxic active ingredients previously sprayed to control the American bollworm [9–11].

    There are not many other examples from India or elsewhere where a single technology has caused agronomic, economic and environmental benefits in a similar magnitude.Against this background, Kranthi and Stone’s statement that “the surge in yields has been uncritically attributed to Bt seed” is not correct. Of course, there are other factors that contributed to the observed doubling of yields between 2002 and 2008 but the 24% estimate by Kathage and Qaim is the net effect of Bt technology after controlling for other factors [7]. Using longer-term data but inap-propriate methodologies to challenge earlier results, as Kranthi and Stone do in their article, is not convincing. Bt cotton has increased yields through better pest control and has benefited adopting farm-ers in India and several other developing countries [12–14].

    References
    1. Kranthi, K. R. & Stone, G. D. Long-term impacts of Bt cotton in India. Nat. Plants6, 188–196 (2020).
    2. Datta, S. et al. India needs genetic modification technology in agriculture. Curr. Sci.117, 390–394 (2019).
    3. Qaim, M. The economics of genetically modified crops. Annu. Rev. Resour. Econ.1, 665–693 (2009). Bt cotton, yields and farmers’ benefitsMatin Qaim ✉arising from K. R. Kranthi and G. D. Stone Nature Plants https://doi.org/10.1038/s41477-020-0615-5 (2020)–70–50–30–1010305070Cotton yieldInsecticidequantityCotton profitFarm householdliving standardBt effect (%)Fig. 1 |Net effects of Bt cotton adoption in India (2002–2008). Mean percentage effects are shown with standard error bars. Results are based on plot-level and household-level panel data collected in four rounds between 2002 and 2008. Net effects of Bt cotton were estimated with panel data regression models and differencing techniques to control for observed and unobserved confounding factors 7,9,11 Nature Plants| www.nature.com/natureplants matters arisingNature PlaNts
    4. Crost, B., Shankar, B., Bennett, R. & Morse, S. Bias from farmer self-selection in genetically modified crop productivity estimates: evidence from Indian data. J. Agric. Econ.58, 24–36 (2007).
    5. Qaim, M., Subramanian, A., Naik, G. & Zilberman, D. Adoption of Bt cotton and impact variability: insights from India. Rev. Agric. Econ.28, 48–58 (2006).
    6. Subramanian, A. & Qaim, M. The impact of Bt cotton on poor households in rural India. J. Dev. Stud.46, 295–311 (2010).
    7. Kathage, J. & Qaim, M. Economic impacts and impact dynamics of Bt(Bacillus thuringiensis) cotton in India. Proc. Natl Acad. Sci. USA109, 11652–11656 (2012).
    8. Krishna, V., Qaim, M. & Zilberman, D. Transgenic crops, production risk and agrobiodiversity. Eur. Rev. Agric. Econ.43, 137–164 (2016).
    9. Krishna, V. V. & Qaim, M. Bt cotton and sustainability of pesticide reductions in India. Agric. Syst.107, 47–55 (2012).
    10. Veettil, P. C., Krishna, V. V. & Qaim, M. Ecosystem impacts of pesticide reductions through Bt cotton adoption. Aust. J. Agric. Resour. Econ.61, 115–134 (2017).
    11. Kouser, S. & Qaim, M. Impact of Bt cotton on pesticide poisoning in smallholder agriculture: a panel data analysis. Ecol. Econ.70, 2105–2113 (2011).
    12. Ali, A. & Abdulai, A. The adoption of genetically modified cotton and poverty reduction in Pakistan. J. Agric. Econ.61, 175–192 (2010).
    13. Qiao, F. Fifteen years of Bt cotton in China: the economic impact and its dynamics. Wo r l d D e v.70, 177–185 (2015).
    14. Qaim, M. Role of new plant breeding technologies for food security and sustainable agricultural development. Appl. Econ. Perspect. Policy42, 129–150 (2020)
    Matin Qaim is a professor in the Department of Agricultural Economics and Rural Development at the University of Goettingen in Germany. Visit his website. Follow Matin on Twitter @MatinQaim
    The letter was originally published in Nature Plants and has been republished here with permission. Nature Plants can be found on Twitter @NaturePlants
    Cameron English is a Science writer and the Managing Editor at Genetic Literacy Project.
    Jon Entine is a renowned journalist, author, though-leader and the Founder and Executive Director of the Genetic Literacy Project.
    This article is republished from the Genetic Literacy project under the Creative Commons 4.0

    Image Credit: GLP and India Times

  • Is MGNREGA a Sustainable Employment Option for Migrants?

    Is MGNREGA a Sustainable Employment Option for Migrants?

    Covid-19 certainly has kindled a renewed focus on healthcare systems, sanitation, and most importantly, employment in the rural areas of the country. The pandemic has thrown light on the huge inadequacies and challenges of our healthcare structure that the government and the citizens had not foreseen. Millions of skilled and unskilled migrants moved across the country in droves to their hometowns in the absence of income and work and means to sustain their life. Around 30 Million (3 Crore) or 15-20% of the total urban workforce left for their hometowns, accounting for the largest ever reverse migration trend in the country, exclusive of intra-state migration. The World Bank in its report mentioned that a whopping number of 40 million internal migrants were harshly affected by the lockdown. Now that the country is just a few steps from opening up in full, concerns about workers moving back in search of work remain in the air. The Mahatma Gandhi National Rural Employment Guarantee Act (MGNREGA), which has a mixed track record in sustaining the livelihood of people in distress by providing guaranteed employment and considerate wages might be the only way out for the worst of the worst-affected. But, will the scheme be a viable and sustainable employment option for the days and years to come? This article aims to answer the question of efficiency, significance, and sustainability of MGNREGA in rural employment in the country.

    What is MGNREGA?

    MGNREGA, the world’s largest guarantee work programme, is the legitimised pioneer of the fundamental ‘Right to Work’. The scheme does that by providing a time-bound guarantee of work for 100 days a year, with considerate fixed wages. Workers under the scheme are assigned to agriculture and related capacity building projects thus ensuring sustainable development for all, as advocated by Gandhi. The scheme has reasonable success stories to its credit, all across the country. A study by Parida (2016) at Odisha proves that MGNREGA has played an important role in the agricultural off-season by providing work to the needy, the poor, and the socially marginalised communities. In various villages in Sikkim, families under MGNREGA were more self-reliant and less dependent on government programmes for a livelihood, according to the results of an evaluation conducted by the Tata Institute of Social Sciences (2017).

    The Ministry of Finance announced Rs. 40,000 crore fund allocation to MGNREGA on the onset of the fourth phase of lockdown in May, while under the Atmanirbhar Bharat Abhiyan, the government plans in creating jobs for 300 Crore persons, and the national average wages of workers also saw an increase from Rs. 182 per day per person to Rs. 202, with effect from April 1st, 2020. All of these might come off as a huge sigh of relief to the worst affected, but in many states, the scheme wage rates are lower than the minimum wages in the respective states. So, this increase in wages does not hold huge significance in reality.

    Unemployment and Work Allocation Concerns

    Reverse Migration Trends and Unemployment:      Unemployment has always been a perennial problem for a developing country like India, especially in times of crisis. The unemployment rate of the country reached an all-time high of close to 24% in April, while the rate of unemployment is expected to reach 8-8.5% in 2020-21, which may increase owing to the reverse migration trends. According to the Former Chief Statistician of India, rural unemployment is now a double-edged sword, given the impact of different migration trends. The reverse migration trends have altered the demand-supply dynamics in rural India significantly. Areas that previously had negative net migration rates are now expected to experience labour surplus, while the locations that may need workers might lack supply. The trends in reverse migration and its impact on local employment in states are visible, with Uttarakhand topping the charts in both the number of reverse migrants and the unemployment rate at around 22.3% as of September. The state is followed by Tripura at 17.4% and Bihar at 11.9%. Thus a strong correlation can be inferred between the amount of reverse migration and the unemployment rate in a given state.

    Putting together numbers of short-term and long-term vulnerable workers gives us a total of about 13 Crore (130 million) workers, who are deeply affected by the Covid-19 crisis.

    Another trend that is recognisable from literature is that migration is no longer a one-way street. Seasonal and circular migration continues to grow and take various forms (Conell et.al., 1976). Amongst these, vulnerable circular migrants are termed as the most distressed section of migrants, which include both Short-term seasonal and long-term occupationally vulnerable workers. Srivastava (2020) has estimated the number of 5.9 crore short-duration circular migrant workers in the year 2017-18. In the same study, vulnerable long-term circular migrants have been identified at 6.9 crores in the same period. Putting together numbers of short-term and long-term vulnerable workers gives us a total of about 13 Crore (130 million) workers, who are deeply affected by the Covid-19 crisis.

    Work Allocation Concerns:     Besides, The Taskforce for Eliminating Poverty constituted by Niti Aayog in the year 2015 (Occasional Paper,2016) has noted that most beneficiaries under the MGNREGS have been on an average get only 50 days of work. This shows that the scheme requires a better mechanism that recommends better targeting of the poorest of the poor and gets them guaranteed work for 100 days. Additionally, if 50-60% of the migrant workers in urban India (2018 above) return to their home destinations, then the scheme has to accommodate between 5.5 – 6.6 crore new workers, which will add 50 – 60% weight on people to be accommodated under the scheme. This exerts additional pressure on the already drying up state funds, which means catering to the huge number of migrants might not be economically sustainable for a long period.

    Wages and Work Efficiency under MGNREGA

    The wage rate in MGNREGA has been a huge concern for policymakers across India. While the recent increase in wages seemed quite positive at the onset, the wage hike is lesser than the minimum wage rate in certain states. Wage rates in the year 2019 seemed to be on the same trajectory, with the MGNREGA wage hike being lesser than the minimum wages in 33 states. Long payment delays also with meager wages add to the burden on workers under the scheme. Another important loophole in the scheme is the availability of work for such a huge number of workers seeking work under the scheme. In most cases, work is inadequate for such a huge number of workers. The standing committee report on rural development for the year 2012-13 also mentioned a significant decline in annual work completion rates (%). According to the report, work completion rates have taken a deep plunge consecutively in the years after 2011, with work completion rates of 20.25% for the year 2012, and 15.02% for the year ending 2013. Such dismal performances also throw light on the lack of productive allocation of work under the scheme. All of these certainly are results of the weakening of the act.

     CONCLUSION

     While MGNREGA fails in addressing a lot of important issues, COVID-19 certainly allows it to fit the dynamic changes in employment and work conditions. Making amendments to the act can be the only way out if the act needs to be sustainable in the long term. MGNREGA gives a rights-based framework to migrants seeking skilled and unskilled labour opportunities but lacks in giving enough benefits to the workers. Work under the scheme should be allocated efficiently, as per the project needs. While COVID-19 put a halt to a lot of existing projects, a lot of new projects are on the anvil. Catering to the needs arising on account of the pandemic including sanitation infrastructure building projects and infrastructure and rehabilitation projects can help the scheme diversify its project base, thus increasing employment opportunities to the migrants. Agriculture, the only positive contributor to the GDP of the country should be taken advantage of in the situation. A strong work evaluation setup should be made sure of, that would efficiently track work completion records thus giving opportunities for workers to complete the incomplete projects. This will yield benefits in both completion of a project and increased workdays and consequently increased wages for a worker.

    Cash-based transactions can be a game-changer in this scenario. Instead of reliance on Aadhar, the unbanked should be remunerated regularly by the means of cash.

    Need for Cash-Based Wage Transfer:      While cash crunch and plunging aggregate demand are looming over the country’s economy, MGNREGA can be used as a tool to put money in the hands of the needy. The propensity to consume of a rural worker is way higher than that of an urban employee. Cash-based transactions can be a game-changer in this scenario. Instead of reliance on Aadhar, the unbanked should be remunerated regularly by the means of cash. Bank and Post office ways of remunerating workers surely did have an impact on corruption, but irregular payments and lack of access to formal banking systems are a common testimony among the migrants. Reverse migration is also the beginning of people bringing themselves into the formal cycle of work, with their enrolment under MGNREGA. Tapping the untapped potential and better engagement and benefits to workers under the scheme will largely increase its base and efficiency. If states learn from their past mistakes and amend the working system of the act, then surely it may do wonders in rural employment in the country.

    Image Credit; The Quint

  • Living Next to China: India’s Economic Challenge

    Living Next to China: India’s Economic Challenge

    Abstract

    Hampered by declining economic growth, India needs to take bold and practical economic measures to overcome the adverse impact of the coronavirus pandemic, compounded by past economic blunders such as the demonetisation and the haphazard implementation of the GST regime. Mohan Guruswamy analyses that the seeds of the current economic slide were sown by the UPA II regime by its populist measures that were wasteful, unproductive, and reduced capital expenditure. Non action by the NDA governments on these issues has made it worse. He argues that India must not shy away from recourse to deficit financing to overcome the current unprecedented challenges faced by the economy on account of the Covid-19 disruption. India needs to increase its stimulus package from a mere 0.3% of the GDP to at least 10% to boost economic revival and growth. India’s reserves of $490 billion ($530 billion as of recent figures) is available to be tapped for economic revival. The measures must focus on addressing the severe impact on weaker sections of the society such as the poor, lower middle-class, and the farmers.

    The Covid2019 shock hit all world economies and has caused a serious contraction in all of them. Ironically, in the advanced economies like the USA, UK, Japan, and others, it exposed their intrinsic strengths with highly evolved social security systems by and large being able to absorb the labor displacement and the ability to quickly put together a fiscal fight back plan. Even China has been able to quickly recover its pole position as the worlds leading exporter and industrial production center. In India, Covid2019 exposed our co-morbidities, and has further opened the traditional faultlines, with the large unorganized labor cohort bearing the brunt of the costs. At last count the CMIE estimates over 130 million daily wagers in the urban centers being rendered jobless and homeless.[i] India’s economy which has been in distress for most of the last decade in now seriously stricken.

    When India’s economic history is written in some future date, and when a serious examination is done of when India lost its way to its ‘tryst with destiny’, the decade of 2010-20 will be highlighted.

    When India’s economic history is written in some future date, and when a serious examination is done of when India lost its way to its ‘tryst with destiny’, the decade of 2010-20 will be highlighted. The facts speak for themselves. India’s real GDP growth was at its peak in March 2010 when it scaled 13.3%.  The nominal GDP at that point was over 16.1%. The nominal GDP in September 2019 was at 6.3%, it’s lowest in the decade. Since then the downward trend is evident and we are now scraping the bottom at about a real GDP growth rate of 4.5%, this too with the push of an arguably inflationary methodology. Our previous CEA, Arvind Subramaniam, estimated that India’s GDP growth is overestimated by at least 2.5%. BJP MP and economist Subramaniam Swamy was even more pessimistic. He estimated it to be 1.5%.

    The decline in the promise is amply evident by the change in the make up of the economy during this decade.  In 2010 Agriculture contributed 17.5% of GDP, while Industry contributed 30.2% and Services 45.4%.  In 2019 that has become 15.6%, 26.5% and 48.5% respectively.  The share of industry has been sliding.  This is the typical profile of a post-industrial economy.  The irony of India becoming post-industrial without having industrialized must not be missed.

    Decline in Capital Investment

    The most significant cause for the decline of growth is the decline in capital investment.  It was 39.8% of GDP in 2010 and is now a good 10% lower.  Clearly without an increase of capital investment, one cannot hope for more industrialization and hence higher growth.  What we have seen in this decade is the huge increase in Services, which now mostly means increase in Public Administration and informal services like pakora sellers.

    In 2010 it seemed we were well on track.  But now we are struggling to get past $3 trillion, and the $5 trillion rendezvous that Modi promised by 2024 will have to wait longer.

    At the turn of the century, as China’s GDP began its great leap forward (from about $1.2 trillion in 2010 to $14.2 trillion in 2019), was also a heady moment for India whose GDP of $470 billion began a break from the sub 5% level of most of the 1990’s to the rates we became familiar with in the recent past (to hit a peak stride of 10.7% in 2010). At that point in time, if growth rates kept creeping up, we could have conceivably gone past $30 trillion by 2050. But for that the growth rate should consistently be above 7%. It seemed so feasible then.  In 2010 it seemed we were well on track.  But now we are struggling to get past $3 trillion, and the $5 trillion rendezvous that Modi promised by 2024 will have to wait longer.

    To be fair to Modi and the NDA, the decline began early in the second term of the UPA when capital expenditure growth had begun tapering off.  Dr. Manmohan Singh is too canny an economist to have missed that.  But UPA II also coincided with the increasing assertion of populist tendencies encouraged by the Congress President and her extra-Constitutional National Advisory Council. The decline in the share of capital expenditure was accompanied by a huge expansion in subsidies, most of them unmerited.  Instead of an increase in expenditure on education and healthcare, we saw a huge expansion in subsidies to the middle and upper classes like on LPG and motor fuels. Even fertilizer subsidies, which mainly flow to middle and large farmers with irrigated farmlands, saw a great upward leap.  Clearly the money for this came from the reduction in capital expenditure.  Modi’s fault in the years since 2014 is that he did nothing to reverse the trend, and only inflicted more hardship by his foolish demonetization and ill-conceived GST rollout.

    The realities are indeed stark.  The savings/GDP ratio has been in a declining trend since 2011 and Modi has been unable to reverse it.  Consequently, the tax/GDP ratio and the investment/GDP ratio have also been declining.  The rate of economic growth has been suspect and all objective indicators point to it being padded up. The drivers of economic growth such as capital expenditure is dismal.  Projects funded by banks have declined by over half since 2014 to less than Rs.600 billion in 2018-19.  Projects funded by the market have dropped to rock bottom.  Subsequently the manufacturing/GDP ratio is now at 15%.  Corporate profits/GDP ratio is now at a 15-year-old low at about 2.7%.  You cannot have adequate job creation if these are dipping.  Declining rural labor wage indices testify to this.

    Between October 2007 and October 2013 rural wages in the agricultural and non-agricultural sectors grew at 17% and 15%, respectively.  Since November 2014, however, agricultural and non-agricultural sector wages grew at only 5.6% and 6.5%, respectively. In 2019 average rural wage growth has further fallen to 3.1%.[ii]

    Bharat and India Divide

    It is very clear now that the urban lane has been moving well in India.  Indeed, so well that an Oxfam study revealed that that as much as 73% of the growth during the last five years accrued to just 1% of the population.[iii] This does not mean it is just the tycoons of Bombay and Delhi who are cornering the gains.  Government now employs close to 25 million persons, and these have now become a high-income enclave.  The number of persons in the private and organized sector is about another ten million. In all this high-income enclave numbers not more than 175-200 million (using the thumb rule of five per family).  Much of the consumption we tend to laud is restricted to just these.

    The simple fact that the share of Agriculture is now about 15.6% of GDP and falling, while still being the source of sustenance for almost 60% of the population reveals the stark reality.  A vast section of India is being left behind even as India races to become a major global economy.

    Agriculture is still the mainstay of employment.  Way back in 1880 the Indian Famine Commission “had observed that India had too many people cultivating too little land”.  This about encapsulates the current situation also.  While as a percentage the farmers and farmworkers have reduced as a part of the work force, in absolute terms they have almost tripled since 1947.  This has led to a permanent depression in comparative wages but has also led to a decline in per farmer production due to fragmentation of holdings.  The average farm size is now less than an acre and it keeps further fragmenting every generation.[iv] The beggaring of the farming community is inevitable.  The only solution to this is the massive re-direction of the workforce into less skilled vocations such as construction.

    The simple fact that the share of Agriculture is now about 15.6% of GDP and falling, while still being the source of sustenance for almost 60% of the population reveals the stark reality.  A vast section of India is being left behind even as India races to become a major global economy.

    As the decade ends, the Bharat and India divide have never been more vivid.  Our social scientists are still unable to fix a handle to this because the class, cultural and ethnic divides still eludes a neat theoretical construct.  Yet there can be little disagreement that there are two broad parts to this gigantic country and one part is being left behind.  The distance between the two only increased from 2010 to 2020.  This is indeed the lost decade.  Recovering from this will take long and will be painful.  If we take too long, we might have used up a good bit of the ‘demographic dividend’ and the demographic window of opportunity.  The ageing of India will be upon us by 2050[v].

    Covid-19 Impact – Increasing Economic Disparities 

    In the recent months the onslaught of the Covid2019 induced lockdown has been quite relentless.  From 2004-2014 India’s GDP grew at an average of 7.8%.  At its peak it went past 10% in 2010-11 Then it started slowing down.  The new government was unable to return to the old growth rates because it did not care to learn from the experiences of the previous regime, which began to spend more on giveaways, misguidedly thinking it was welfare economics, and took the accelerator off capital expenditure.  Even though capital expenditure is driven in India by government spending, this government spending is very different from subsidies and giveaways.  Subsidies generally tend to be misdirected with the already well-off garnering most of it.  Minimum Support Prices (MSP) are a huge annual subsidy[vi]and 90% of it accrues to the states of Punjab, Haryana, and the coastal region of Andhra Pradesh.  Fertilizer subsidies tend to accumulate to the advantage of large and medium farmers or to about a quarter of all land holdings.  Ditto for free power.  The only welfare expenditure to benefit farmers is investment in irrigation, rural infrastructure, and social welfare like education and health.  Unfortunately, this has been on the decline.  This has exacerbated disparities, both local and regional.  With capital expenditures declining, job creation suffered and the inevitable slowdown of GDP growth happened.  As we started diving, the government inflicted the so-called Demonetization adding to our woes.  Just as things began to look up, the Covid2019 pandemic overtook us.

    Now the only dispute on national income is how much will be the contraction.  The Finance Ministry hopes there won’t be any. The IMF has officially said it will be 4.5%.  The rating agencies predict a contraction of 6.8%, while many more are suggesting something closer to 10%.  How do we deal with is now?  The government of India has tended to be “conservative” in its outlook and has made no serious suggestion on economic stimulus.  What it calls a stimulus is actually not a stimulus. The problem is more philosophical.

    The divide between the Keynesians and the Chicago school is as intense and often antagonistic as the Sunni-Shia, Catholic-Protestant or Thenkalai-Vadakalai Iyengar divides.

    Keynesian economics is a theory that says the government should increase demand to boost growth. Keynesians believe consumer demand is the primary driving force in an economy.  As a result, the theory supports expansionary fiscal policy.  The Chicago School is a neoclassical economic school of thought that originated at the University of Chicago in the 1930s.  The main tenets of the Chicago School are that free markets best allocate resources in an economy and that minimal or zero government intervention is best for economic prosperity.  They abhor fiscal deficits.

    Inadequate Stimulus Package 

    The instruments used to beat countries like India into submission are ratings agencies such as Moody’s, which just downgraded India.  We shouldn’t lose too much sleep over it.  India is a hardly a borrower abroad and is more of a lender holding $490 billion as reserves.

    The only reason why the actual stimulus package is only Rs.63K crs is the obsession with fiscal deficits by Chicago economists such as Raghuram Rajan and his former student the hapless Krishnamurthy Subramaniam, the present CEA. They are true disciples of the Washington Consensus to judge countries like India by the fiscal deficit size.  The instruments used to beat countries like India into submission are ratings agencies such as Moody’s, which just downgraded India.  We shouldn’t lose too much sleep over it.  India is a hardly a borrower abroad and is more of a lender holding $490 billion as reserves.

    That is why the CEA when asked about a big stimulus said: “There are no free lunches!” That’s exactly what Milton Friedman said. But they quite happily ignore the biggest deficit financed economy in the world is the USA.  Raghuram Rajan told Rahul Gandhi on his videoconference that a stimulus of Rs.65K crores would suffice in the present situation[vii]. The Nobel Laureate Abhijit Bhattacharya and former CEA Arvind Subramaniam suggest a stimulus package like the USA or Japan[viii].  The USA has just announced a stimulus of over $3.5 trillion or over 15% of GDP.  Modi’s stimulus is a mere 0.3% of GDP.

    What is ‘Fiscal Deficit?’ A fiscal deficit occurs when a government’s total expenditures exceed the revenue that it generates, excluding money from borrowings.  Deficit differs from debt, which is an accumulation of yearly deficits.

    Many serious economists regard fiscal deficits as a positive economic event.  For instance, the great John Maynard Keynes believed that deficits help countries climb out of economic recession.  On the other hand, fiscal conservatives feel that governments should avoid deficits in favor of balanced budgets.

    India’s debt/GDP ratio is by contrast a modest 62% and yet it intends to pump in a mere 0.3% of GDP as stimulus.

    The fastest growing economies in the world, and now its biggest – USA, China, Japan and most of Western Europe – have the highest debt/GDP ratios.  Japan’s debt/GDP is over 253% before the latest stimulus of 20% of GDP.  China’s debt is now over 180% of its GDP.  The USAs debt/GDP is close to 105% yet it is raising $3 trillion as debt to get it out of the Covid2019 quagmire.  India’s debt/GDP ratio is by contrast a modest 62% and yet it intends to pump in a mere 0.3% of GDP as stimulus.

    Pump priming the economy by borrowing per se is not bad.  It is not putting the debt to good use that is bad.  Nations prosper when they use debt for worthwhile capital expenditure with assured returns and social cost benefits.  But we in India have borrowed to give it away as subsidies and to hide the high cost of government.  To give an analogy, if a family has to make a choice of borrowing money to fund the children’s education or to support the man’s drinking habit, the rational choice is obvious. The children’s education will have a long-term payback, while the booze gives instant gratification. But unfortunately, our governments have always been making the wrong choices.

    If borrowed money is used productively and creates growth and prosperity, it must be welcomed.  What we want to hear from the government is not about fiscal deficit targets, but economic growth, value addition, employment, and investment targets.  Our governments have hopelessly been missing all these targets.

    Modi’s Options – Need for Bold Decisions

    So, what can Modi do now to get us out of this quagmire?  If the regime abhors a stimulus financed by deficit financing there are other options that can be exercised.  But he is hamstrung with a weak economic management team with novices as the two key players, the Finance Minister and RBI governor.

    India has over $490 billion nesting abroad earning ridiculously low interest.  Even if a tenth of this is monetized for injection into the national economy, it will mean more than Rs.3.5 lakh crores.  At last count the RBI had about Rs.9.6 lakh crores as reserves.  This is money to be used in a financial emergency.  We are now in an emergency like we have never encountered or foresaw before. Even a third of this or about Rs.3.2 lakh crores is about five times the present plan.

    There is money in the trees, and all it needs is a good shake up to pick the fruits. The pain of the lockdown must not be borne by the poor alone.  The government can easily target 5% of GDP or about Rs.10L crores for the recovery fund as an immediately achievable goal.

    There are other sources of funds also, but tapping these will entail political courage and sacrifices. Our cumulative government wages and pension bill amounts to about 11.4% of GDP.  After exempting the military and paramilitary, which is mostly under active deployment, we can target 1% of GDP by just by cancelling annual leave and LTC, and rolling back a few DA increases.

    The government can also sequester a fixed percentage from bank deposits, say 5% of deposits between Rs.10-100 lakhs and 15-20% from bigger deposits for tax-free interest-bearing bonds in exchange.  The ten big private companies alone have cash reserves of over Rs.10 lakh crores[ix].

    There is money in the trees, and all it needs is a good shake up to pick the fruits. The pain of the lockdown must not be borne by the poor alone.  The government can easily target 5% of GDP or about Rs.10L crores for the recovery fund as an immediately achievable goal.

    This money can be used to immediately begin a Universal Basic Income scheme, by transferring a sum of Rs.5000 pm into the Jan Dhan accounts for the duration of the financial emergency; fund GST concessions to move the auto and engineering sectors in particular; begin emergency rural reconstruction projects to generate millions of new jobs and get our core infrastructure sectors like steel, cement and transportation moving again.

    Getting money to move India again is not a huge problem.  What comes in between are the philosophical blinkers.  Call it Chicago economics or the Gujarati mindset.

    Notes

    [i] https://www.businesstoday.in/sectors/jobs/india-unemployment-rate-hits-26-amid-lockdown-14-crore-lose-employment-cmie/story/401707.html

    [ii] https://www.financialexpress.com/economy/farm-wages-growth-fell-to-a-four-quarter-low-in-q3-fy-20/1789235/

    [iii] https://economictimes.indiatimes.com/news/economy/indicators/wealth-of-indias-richest-1-more-than-4-times-of-total-for-70-poorest-oxfam/articleshow/73416122.cms?from=mdr#:~:text=Wealth%20of%20India’s%20richest%201%25%20more%20than%204%2Dtimes%20of,total%20for%2070%25%20poorest%3A%20Oxfam&text=The%20Oxfam%20report%20further%20said,particularly%20poor%20women%20and%20girls.

    [iv] https://www.prsindia.org/policy/discussion-papers/state-agriculture-india

    140 million hectares of land is used as agricultural area, as of 2012-13.  Over the years, this area has been fragmented into smaller pieces of land.  As seen in Table 3, the number of marginal land holdings (less than one hectare) increased from 36 million in 1971 to 93 million in 2011.  Marginal and small land holdings face several issues, such as problems with using mechanization and irrigation techniques.

    [v] https://economictimes.indiatimes.com/news/politics-and-nation/demographic-time-bomb-young-india-ageing-much-faster-than-expected/articleshow/65382889.cms

    [vi] https://www.thehindubusinessline.com/opinion/all-you-wanted-to-know-about-minimum-support-price/article7342789.ece

    [vii] https://www.hindustantimes.com/india-news/in-video-conversation-with-rahul-rajan-suggests-65k-crore-aid-for-poor/story-CtrtvW6HErR16L9m1t9wHP.html

    [viii] https://economictimes.indiatimes.com/news/economy/policy/rahul-gandhi-in-conversation-with-abhijit-banerjee-india-needs-a-bigger-stimulus-package-like-us-japan-to-revive-economy/videoshow/75549770.cms

    [ix] https://www.screener.in/screens/2551/Cash-Rich-Companies/


    Image credit: Adobe Stock

  • India’s Farming Progress Lies In Adoption Of Smart Agriculture

    India’s Farming Progress Lies In Adoption Of Smart Agriculture

    From being a country that was a food importer till the early 1970s, India’s green revolution transformed the country into becoming self-sufficient in food production and a significant exporter of agricultural products. However, Indian agriculture, hampered by marginal farm holdings suffered from poor technology and lack of modernisation, resulting in production that is far below its potential. With a population of 1.24 billion, Indian agriculture is already challenged.
    The Railway versus Irrigation controversy during the early years of the 20th century was evidence that the British undervalued the significance of improving irrigation in an agrarian economy such as India. R C Dutt, in his famous book ‘The Economic History of India in the Victorian Age’, shows the disparity in funds allocated for railways and that for irrigation purposes. The glaring disparity is believed to be one of the reasons for the 1890 famines. Akin to the pre-independence time, the Economic Survey 2019-20 shows static growth in agriculture from 2014 to the present day. The growth rate in agriculture was a negative 0.2% in 2014-15. Inadequate fund allocation, illiteracy of the farmers, deficient safety nets, lack of microcredit organizations and low incentive for the farmers to adopt climate-smart and efficient technology are some of the reasons for prolonged sluggishness in Indian agriculture. India’s prosperous neighbour, China, however, has managed accelerated growth in both agricultural and industrial sectors. The reason is the proactive nature of the Chinese and the ability to make the most out of little. Since the 1990s China has left India far behind in the field of revamping farming techniques. A leader of innovation, China has turned its weaknesses into strength- rooftop agriculture to compensate for the lack of adequate farming land, AI sensing smart robots to store data and supplement human labour, automated water management schemes that led to rice becoming one of Chinas staple food grains. China has surpassed India in rice production, despite India having more available freshwater for crop production. This indicates the need for India to improve its learning curve as far as international agricultural policies are concerned.
    China has surpassed India in rice production, despite India having more available freshwater for crop production.

    Smart Techniques and Precision Farming

    In this vein, the identification of the techniques of smart farming that can give a boost to the decaying agricultural sector of India is critical. Using smarter techniques like Precision farming, efficient water management techniques and Artificial intelligence are sure-shot methods to increase productivity per acre of land. Precision Agriculture avoids the improper and excess application of pesticides and fertilizers and enables the farmer to use land according to its quality and nature. This leads to a reduction in cost, increase in output and climate-friendly agriculture. ‘Big data’ in Precision farming provides the farmer with data regarding soil quality, raw material requirements and weather changes, which can be stored for a later date. This is a massive game-changer for a sector which substantially depends on weather conditions and faces the brunt of climate change. China has been using automated ‘driverless’ tractors, mowers, AI drones to spray pesticides, and smart robotic sensors to analyse environmental conditions. This increases the speed of farming at an exceptional rate. Precision Farming is a potential salvager at a time when the water tables in India are diminishing at a rapid rate due to unprecedented demand by the agricultural and industrial sectors. Smart farming can potentially break the nexus between outmoded agriculture, climate change and hunger. The longer we delay the implementation of such techniques, the closer we move towards an impasse, which even modernisation might not be able to fix.
    ‘Big data’ in Precision farming provides the farmer with data regarding soil quality, raw material requirements and weather changes, which can be stored for a later date. This is a massive game-changer for a sector which substantially depends on weather conditions and faces the brunt of climate change.

    Predicament of Marginal Holdings

    The Indian predicament can be traced back to decades of neglect towards the agricultural sector. Even with plans like ‘doubling farmer’s income by 2022’, most states except Punjab, Haryana and Karnataka have not even envisaged a plan for smart farming. A plethora of structural barriers impedes the coveted modernization required by our agricultural sector. The average size of landholding by an Indian rural household is a marginal 1.1 hectare. This restricts the use of modern equipment like large tractors and robot sensors as a smart substitute for manual labour. The digital illiteracy of the farmers also presents a hurdle owing to the absence of local experts to impart training and information to the farmers. The connectivity and problem of unstable internet is also a cause of roadblock. Government policies historically have adopted a ‘one-size-fits-all’ approach, thus excluding approximately 86% of small and marginal farmers. For schemes like PM-Fasal Bima Yojana, the small farmers have to pay balance of the premium for crop insurance, which is almost impossible for a debt-strapped farmer. The newly extended PM-KISAN scheme requires farmers in a digitally primitive nation to check their balance by registering themselves on a web-portal page. With basic crop insurance schemes not living up to the expectation, we naturally question the efficacy of schemes to promote smart agriculture. The evaluation of the NMMI scheme for Micro Irrigation recorded that the benefit from the scheme did not reach almost half of the intended beneficiaries, even after they applied for it. The PMKSY scheme simply reached a meagre 1/10th of the farming population targeted.
    A plethora of structural barriers impedes the coveted modernization required by our agricultural sector. The average size of landholding by an Indian rural household is a marginal 1.1 hectare.

    Policy Focus for Smart Agriculture

    A dedicated approach to developing smart agriculture with mass disbursements of benefits, education and economic incentives to our farmers will eventually translate into long-run economies of scale for the agricultural community at large. The US government extensively aids research and development in agricultural technology, along with training given to farmers to understand the new technology. The British government, besides allocating 20 million dollars for sustainable agriculture, also incentivizes private aggrotech firms to invest in smart technology. South Korean government has already created 4,300 jobs in the smart agricultural sector through timely action and aid. India, although lagging in several fields, is endowed with cheap rural labour, the second largest arable land area after the US, a leader in global trade in raw agricultural products and a massive potential growth trajectory in agriculture. Extension services and R&D are at a nascent stage in India and only within reach of large farmers. To expand the scale of the programme it is necessary to ease the transition of small and marginal farmers into the ambit of smart farming. Institutional setups, adequate support and building a steady architecture to execute smart farming should be focus areas for the Indian government in the face of dwindling food production.

    References:

    https://www.smart-akis.com/index.php/network/what-is-smart-farming/
    https://www.smartindianagriculture.com/https://www.changemakers.com/discussions/entries/smart-agriculture-helping-structure-new-industry-chinahttps://www.basf.com/cn/en/media/BASF-Information/Food-nutrition/future-farming.htmlhttps://www.youtube.com/watch?v=PdIr6pP-Rec&list=PLTeiJVqL7DL6yhlOMh4lPv_BCQ5KKMgBd&index=2&t=0shttps://www.downtoearth.org.in/coverage/natural-disasters/climate-smart-agriculture-54437https://www.futurefarming.com/Smart-farmers/Articles/2018/5/South-Korea-creates-4300-jobs-in-smart-farm-industry-283765E/https://krishijagran.com/agriculture-world/amazing-how-smart-farming-techniques-by-south-korea-can-future-proof-agriculture/Image Credit: Adobe Stock

  • India’s Agriculture: The Failure of the Success

    India’s Agriculture: The Failure of the Success

    It was around the mid-1960s when the Paddock brothers, Paul and William, the ‘prophets of doom’, predicted that in another decade, recurring famines and an acute shortage of food grains would push India towards disaster. Stanford University Professor Paul R. Ehrlich in his 1968 best selling book The Population Bomb warned of the mass starvation of humans in the 1970s and 1980s in countries like India due to over population.

    Their prophecies were based on a rising shortage of food because of droughts, which forced India to import 10 million tonnes of grain in 1965-66 and a similar amount a year before. Little did they know that thanks to quick adoption of a new technology by Indian farmers, the country would more than double its annual wheat production from 11.28 million tonnes in 1962-63 to more than twice that within ten years to 24.99 million tonnes. It was 71.26 million tonnes in 2007. Similarly rice production also grew spectacularly from 34.48 million tonnes to almost 90 million tonnes in 2007.

    Total food grains production in India reached an all-time high of 251.12 million tonnes (MT) in FY15. Rice and wheat production in the country stood at 102.54 MT and 90.78 MT, respectively. India is among the 15 leading exporters of agricultural products in the world. The value of which was Rs.1.31 lakh crores in FY15.

    India is among the 15 leading exporters of agricultural products in the world. The value of which was Rs.1.31 lakh crores in FY15.

    Despite its falling share of GDP, agriculture plays a vital role in India’s economy. Over 58 per cent of the rural households depend on agriculture as their principal means of livelihood. Census 2011 says there are 118.9 million cultivators across the country or 24.6 per cent of the total workforce of over 481 million. In addition there are 144 million persons employed as agricultural laborers. If we add the number of cultivators and agricultural laborers, it would be around 263 million or 22 percent of the population. As per estimates by the Central Statistics Office (CSO), the share of agriculture and allied sectors (including agriculture, livestock, forestry and fishery) was 16.1 per cent of the Gross Value Added (GVA) during 2014–15 at 2011–12 prices. This about sums up what ails our Agriculture- its contribution to the GDP is fast dwindling, now about 13.7 per cent, and it still sustains almost 60 per cent of the population.

    If we add the number of cultivators and agricultural laborers, it would be around 263 million or 22 percent of the population. As per estimates by the Central Statistics Office (CSO), the share of agriculture and allied sectors (including agriculture, livestock, forestry and fishery) was 16.1 per cent of the Gross Value Added (GVA) during 2014–15 at 2011–12 prices.

    With 157.35 million hectares, India holds the world’s second largest agricultural land area. India has about 20 agro-climatic regions, and all 15 major climates in the world exist here. Consequently it is a large producer of a wide variety of foods. India is the world’s largest producer of spices, pulses, milk, tea, cashew and jute; and the second largest producer of wheat, rice, fruits and vegetables, sugarcane, cotton and oilseeds. Further, India is 2nd in global production of fruits and vegetables, and is the largest producer of mango and banana. It also has the highest productivity of grapes in the world. Agricultural export constitutes 10 per cent of the country’s exports and is the fourth-largest exported principal commodity.
    According to the Agriculture Census, only 58.1 million hectares of land was actually irrigated in India. Of this 38 percent was from surface water and 62 per cent was from groundwater. India has the world’s largest groundwater well equipped irrigation system.

    There is a flipside to this great Indian agriculture story.The Indian subcontinent boasts nearly half the world’s hungry people. Half of all children under five years of age in South Asia are malnourished, which is more than even sub-Saharan Africa.

    More than 65 per cent of the farmland consists of marginal and small farms less than one hectare in size. Moreover, because of population growth, the average farm size has been decreasing. The average size of operational holdings has almost halved since 1970 to 1.05 ha. Approximately 92 million households or 490 million people are dependent on marginal or small farm holdings as per the 2001 census. This translates into 60 per cent of rural population or 42 per cent of total population.

    Approximately 92 million households or 490 million people are dependent on marginal or small farm holdings as per the 2001 census.

    About 70 per cent of India lives in rural areas and all-weather roads do not connect about 40 per cent of rural habitations. Lack of proper transport facility and inadequate post harvesting methods, food processing and transportation of foodstuffs has meant an annual wastage of Rs. 50,000 crores, out of an out of about Rs.370, 000 crores.

    There is a pronounced bias in the government’s procurement policy, with Punjab, Haryana, coastal AP and western UP accounting for the bulk (83.51 per cent) of the procurement. The food subsidy bill has increased from Rs. 24500 crores in 1990-91 to Rs. 1.75 lakh crores in 2001-02 to Rs. 2.31 lakh crores in 2016. Instead of being the buyer of last resort FCI has become the preferred buyer for the farmers. The government policy has resulted in mountains of food-grains coinciding with starvation deaths. A few regions of concentrated rural prosperity.

    The total subsidy provided to agricultural consumers by way of fertilizers and free power has quadrupled from Rs. 73000 crores in 1992-93, to Rs. 3.04 lakh crores now. While the subsidy was launched to reach the lower rung farmers, it has mostly benefited the well-off farmers. Free power has also meant a huge pressure on depleting groundwater resources.
    These huge subsidies come at a cost. Thus, public investment in agriculture, in real terms, had witnessed a steady decline from the Sixth Five-Year Plan onwards. With the exception of the Tenth Plan, public investment has consistently declined in real terms (at 1999-2000 prices) from Rs.64, 012 crores during the Sixth Plan (1980-85) to Rs 52,107 crores during the Seventh Plan (1985-90), Rs 45,565 crores during the Eighth Plan (1992-97) and about Rs 42,226 crores during Ninth Plan (1997-2002).

    With the exception of the Tenth Plan, public investment has consistently declined in real terms (at 1999-2000 prices) from Rs.64, 012 crores during the Sixth Plan (1980-85) to Rs 52,107 crores during the Seventh Plan (1985-90), Rs 45,565 crores during the Eighth Plan (1992-97) and about Rs 42,226 crores during Ninth Plan (1997-2002).

    Share of agriculture in total Gross Capital Formation (GCF) at 93-94 prices has halved from 15.44 per cent to 7.0 per cent in 2000-01. In 2001-02 almost half of the amount allocated to irrigation was actually spent on power generation. While it makes more economic sense to focus on minor irrigation schemes, major and medium irrigation projects have accounted for more than three fourth of the planned funds
    By 2050, India’s population is expected to reach 1.7 billion, which will then be equivalent to nearly that of China and the US combined. A fundamental question then is can India feed 1.7 billion people properly? In the four decades starting 1965-66, wheat production in Punjab and Haryana has risen nine-fold, while rice production increased by more than 30 times. These two states and parts of Andhra Pradesh and Uttar Pradesh now not only produce enough to feed the country but to leave a significant surplus for export.

    Since food production is no longer the issue, putting economic power into the hands of the vast rural poor becomes the issue. The first focus should be on separating them from their smallholdings by offering more gainful vocations.

    Farm outputs in India in recent years have been setting new records. It has gone up from 208 MT in 2005-06 to an estimated 251 MT in 2014-15. Even accounting for population growth during this period, the country would need probably around 225 to 230 MT to feed its people. There is one huge paradox implicit in this. Record food production is depressing prices. No wonder farmers with marketable surpluses are restive.

    India is producing enough food to feed its people, now and in the foreseeable future. Since food production is no longer the issue, putting economic power into the hands of the vast rural poor becomes the issue. The first focus should be on separating them from their smallholdings by offering more gainful vocations. With the level of skills prevailing, only the construction sector can immediately absorb the tens of millions that will be released. Government must step up its expenditures for infrastructure and habitations to create a demand for labor. The land released can be consolidated into larger holdings by easy credit to facilitate accumulation of smaller holdings to create more productive farms.

    Finally the entire government machinery geared to controlling food prices to satisfy the urban population should be dismantled. If a farmer has to buy a motorcycle or even a tractor he pays globally comparative prices, why should he make food available to the modern and industrial sector at the worlds lowest prices?
    Why should Bharat have to feed India at its cost?

    Image: Kanyakumari farm lands during onset of monsoon. 


  • Rural Development and Gender Equality: A reality check in Tamilnadu

    Rural Development and Gender Equality: A reality check in Tamilnadu

    Category : Agriculture/Rural Development/Gender Equality

    Title : Rural development and gender equality: A reality check in Tamilnadu

    Author : Manjari Balu 06.01.2020

    Tamilnadu continues to be one of the fastest growing states in India, despite some major declines due to political instability, rampant corruption, and populist measures at the cost of development. Despite significant progress in literacy, women’s education, and some aspects of social security, there are still major shortfalls with respect to rural employment, skill development, and gender wage inequality. Tamilnadu has to develop a policy framework to achieve employability through quality secondary education for women, shifting focus from only enrolment of girls in primary education. Manjari Balu analyses this issue in Tamilnadu.


    Read More

  • Problems of Indian Agriculture: Low Incomes, Marginal Farmers , and lack of Modernisation

    Problems of Indian Agriculture: Low Incomes, Marginal Farmers , and lack of Modernisation

    Manjari Balu                                                                                                   August 23, 2019/Analysis

    Substantial fall in the number of farmers in the past decade with stagnant agriculture growth of 2.88 per cent corroborates the bleak condition of the Indian agriculture sector. The dire status of the agriculture assigns the state to either invest for agriculture (asset creation) or invest in agriculture (includes subsidized input). The ostensible manifestation for agriculture is visible during the union budget 2019 with falling public investment for agriculture even as budget expenditure rises. The number of cultivator has decreased by 7.5 per centfrom 2001 to 2011 but the number of labourers engaged in agriculture increased by 3.5 per cent for the same years. Contextualizing the movement of labourers with the ambitious plan of doubling the farmers’ income urges the need to investigate the income and wages which currently stands at INR 8931 per month. This figure includes both large landowners and marginal farmers   In the year 2018, waves of protests sparked off across the country, with disgruntled farmers demanding better support prices and waivers of loans. Fear mounted that frustrated farmers would jeopardise the electoral victory of the ruling party. In response, an annual cash transfer of INR 6000 to all marginal farmers was announced in the interim budget of 2019. The strategy paid off. Post-poll survey shows that around 68 per cent of Indian farmers were satisfied with the record of the BJP led government despite strong protests demonstrated earlier in the same year.

    Investments and Subsidies : Misplaced Priorities

    Marginal farmers account for 86 per cent of India’s total farmers. The government has proposed an allocation of INR 85,000 crore in the interim budget to directly support the small farmers and boost their income levels. The re-election of BJP to power is an approval from the agrarian society for idealistic pledges with an ultra-nationalistic manifesto.  But the party in power is resorting to increasing the quantum of spending on agriculture without addressing fundamental issues of the sector. Almost half of the population is engaged in agriculture and the sector accounts for nearly 17 per cent of total Gross Domestic Product (GDP). The 2019 budget has allotted INR 1,51,000 crores for agriculture and allied sectors; this constitutes a 75 per cent hike from the previous budget. Subsidies on fertilizers occupy a highly prominent position in the budget expenditure; INR 73,435 crores is budgeted for fertilizer subsidies for the year 2018-19. Fertilizer subsidy is increasing at an annual rate of 11.4 percent while the share of public investment in agriculture is a mere 0.4 percent of the total investment. The rationale behind large fertilizer subsidies is to reduce input cost and thereby increasing income margin of the farmers. However, a study conducted to assess the impact of different investment components on return on agriculture ranked subsidies below investment in Research & Development (R&D). The output elasticity of the States for expenditure varies from high-income states to low-income states. A state-wise subsidies plan has to be strategized to have a remunerative effect on the productivity and hence the income of the farmers.

                A disproportionate investment in subsidies might lead to short term rise in income but at the cost of long term productivity. The rising burden of liabilities to fertilizers companies is straining the government’s fiscal position. Comptroller Audit General India has criticized the recent budget for resorting to off-budget financing (to cover subsidies through bank loans) to reach the 3.3 per cent target of fiscal deficit. Such offset financing severely strains the government balance sheet and mounting liabilities would dent the future economy.

    Public investment in agriculture is much lower than private investment. In 2016-17, government spending on capital formation stood at only INR 45,981 crore while private spending was INR 2,19,371 crores. While overall public spending has been growing, the share of capital formation in the budget is relatively low.

    Agriculture Strategies in Indian and China: Difference is Technology and Modernisation

     An elementary comparison of India’s growth in agriculture with China highlights the divergent growth due to the different strategies adopted during their post-reformperiod. China focused on irrigation and invested in technology to attain efficiency in water management. The Total Factor Productivity (TFP) which measures the economic efficiency of inputs estimates China’s agriculture TFP to be growing at an average rate of 3.40 percent post the reforms. In contrast, India’s post reforms agriculture TFP stood at around 0.54 percent illustrating the deficiency in technology investment and excessive subsidies on credit, power and fertilizers. China’s indisputable focus was on rural spatial restructuringand land consolidation. Optimizing land-usepatterns and investing in rural regions to enhance productivity can be a transformative solution to address the problems created by industrialization. The remarkable success of China can also be attested to the stabilization of agricultural subsidies in the year 2009. Though input subsidies in 2004 were exponentially growing, the Chinese government conceded the inefficiency of resources allocated to the farmers.

    The principal justification behind institutionalising subsidies on credit, irrigation and fertilizers is to bolster marginal farmers in minimizing the difference between input costs and output prices. The input cost is primarily financed by short term agriculture credit; the short term crop loan has increased by 18 per cent from 2014 to 2018. Theoretically, a positive trend in the short term credit to farmers duplicates the function of subsidies to reduce the input cost. The dispensable expenditure on subsidies can be reduced if state prioritizes to streamline the credit flow to avoid leakages in the system. A fundamental task of the government is to channelize the gain from productivity and translate it to income and wages. Input cost reduction approach, in the long run, suffers from a potential threat of income being concentrated in the large land cultivators while labourers are discouraged to take up farm jobs.

    Income Wage paradox

    The average operational landholding reduced from 2.28 hectares in 1970-71 to 1.08 hectares in 2015-16 as a result of excessive land fragmentation with a swelling rural population. Farmers from India’s rural areas generate income majorly from cultivation and wages. Mahatma Gandhi National Rural Employment Guarantee Act is one such gambit to accelerate employment and incomes of the rural populace. Though the state intervention in the rural labour market has been acclaimed to the extent that it engages India’s unskilled labour force, the flaws of national workfare program are only too apparent with poor monitoring and supervision. A visible trend of farm labourers moving togovernment employment programs has contributed to the recent labour scarcity in agriculture. A shortfall of the labour force in labour-intensivecrops invariably inflates the wage even in the absence of skill augmentation and mechanization of agriculture. Rural workers are more attracted to employment programs as it offers fixed wages as opposed to volatile wage rates in agriculture.

    The union budget has provided an abstract roadmap to increase the income by hiking the Minimum Support Price (MSP) and reducing the input cost. Overall, the average daily wage rates of agriculture labourers in real terms are observed to be falling rapidly from 11.08 percent (derived from government data) in 2007-08 to 4.3 percent in 2018-19. The implication of government strategies to increase the farmers’ income and not that of the labour is based on the assumption that the profit is effectively channelized as wages. However, the discernible movement of the workforce from a labour-intensive agriculture sector to the service sector on account of surety implies the failure of State to stabilise income through agriculture. Indian agriculture has achieved only 40 percent of mechanization while the United States of America has 95 percent of farm mechanization. A transition to capital intensive production would justify a movement of labourers from the agriculture sector to the non-farmsector, but the majority of the farms being labour intensive faces low productivity due to the labour shift.  The disturbed labour market offers higher wages in agriculture but labourers choose to settle for the employment program due to less skill requirement and guarantee of a minimum wage. The farmers in need of labourers, work at a below optimal level with less productivity as it is hard to afford labourers at a higher wage. To untie the complex knot- dynamics of labourers and farmers, it needs to be thoroughly examined to achieve enhanced productivity through income. A mere cash transfer or subsidizing input cost would not guarantee higher income or efficient productivity in the long run.

    A quantitative study conducted to analyse income inequality in the agriculture sector concluded that there has been little change in the structural and distributional factors in the agricultural economy. The findings of the study stated that inequality in income is driven by the share of land ownership. The importance of examining income affected by land size is more relevant as the continuous land fragmentation gains logical attention with an income determined framework proposed by the government. Thus an important fact to be recognizedis that the marginal farmer households earn 9 percent of the total agriculture income while medium and large farmers earn 91 percent of the income. Evidence for growing income inequality based on the land size and land ownership implies the state expenditure has to be designed to redistribute the investment with a view to minimizing the disparity.

    Need for Effective Policy Alternatives

    There is a pressing need to consolidate land holdings and address the deteriorating quality of soil and incentivize farmers to specialize in production by cooperative farming. Self Help Groups is a success story for community-drivenentrepreneurship, a similar model can be experimented in agriculture, factoring the viability and feasibility. A revision of land reform policies to restructure the arable lands for achieving higher productivity needs to be factored in the entire spending formula. There should be a balance in capital and revenue expenditure for agriculture to avoid concentration of funds only on overheads. The state should facilitate a platform for a smooth transition from labour intensive to capital intensive agriculture from both sides. Incentivize farmers to own lands that can be mechanized and equip the residual labourers with skills to acquire jobs in the service and manufacturing sector. A prime target of improving productivity and maintaining the ecological balance has to be influenced to enhance the living standards of farmers.

    Three critical paradoxes that are driving Indian agriculture need to be studied in detail for  better fiscal and policy decisions. These are (i) problem of low productivity despite availability of abundant arable land with a tremendous history of agrarian community, (ii) Bulging population with increasing unemployment yet labour shortage in agriculture sector, and (iii) huge share of agriculture expenditure yet no substantial asset creation or returns on investment. Central government must assess the quality of natural resources and make initiatives for precision farming a priority component in respective states. A revision of labour wages based on productivity and employment programs have to be framed to engage workers in building agriculture infrastructure. The choice of viewing income as a means to achieve productivity or income as an end to beguile the voters during the election season lies with the government.

    Manjari Balu is a Research Analyst with The Peninsula Foundation.

    Photo : Small Farm in Vellore Dt, Tamilnadu, India.  Credit: M Matheswaran

  • India’s Farm Distress: Priority and a Challenge for the New Government

    India’s Farm Distress: Priority and a Challenge for the New Government

    Manjari Balu                                                                                                         May 30, 2019/Analysis

    A deliberate campaigning strategy of the National Democratic Alliance (NDA) led by Prime Minister Narendra Modi has yielded an expected victory in the 2019 Lok Sabha election. The election season had sparked off many appealing promises; one of them pertains to, agriculture, the most critical sector of the Indian economy. The agriculture sector contributes to 12.2 % of the GDP (it has fallen from 17.6% in 2004-05 to 12.2% in 2016-17) for the year 2017-2018 and roughly employs 50 % of the total workforce. The agrarian structure continues to suffer while political parties competed on the delusory promises during the campaigns. NDA government with a special focus on agrarian society has branded its promise to double each marginal farmer’s income by 2022. A pedestrian cash transferscheme has been propelled during the interim budget to provide INR 6000 (per year) to all the marginal farmers who hold less than 2 hectares of land. A valid scepticism about the promise stems out of the fact that there exist an unavailability of data about the farmers’ income and all the political parties refuse to talk about the farmers’ current income. Cash transfer scheme being an attempt to mollify the accumulated antipathy among the public especially farming community has to be scrutinized and put under the radar for substantial discussion.

    Agriculture Distress and the Marginal Farmer

    According to last published NSSO figures for the years 2012-13, farmers’ income averaged out to INR 6,424. Extrapolating the past data to arrive at the 2018-19 income using Compound Annual Growth Rate (CAGR) to the nominal gross value added components of agriculture, cash transfer of 6000 would account for merely 6 % of the total farmers’ income. The Chief Economic Advisor claimed that the annual transfer to marginal farmers would be 17 %, an assertion backed with no clarification. The nebulous methodology to estimate income seems to question the effectiveness of such a policy instrument to address the perennial agricultural distress.

     The agrarian economy has been volatile over the past few years and the well-being of the farmers have always been the litmus test to review the performance of the sector. Around 87 % of the farmers are small and marginal farmers with less than 2 hectares of land holding, this figure seems to be swelling- indicating an objective failure of the land consolidation reforms in the past few years.

     There is a steady decline in the population engaged in agriculture to the total percentage of employment since the beginning of the independence. Displacement of agriculture labours to other sectors is inevitable if there is a gradual policy shift to mechanization of agriculture and capital formation, the eventual effect of the investment is ought to be reflected in the productivity. But between the years 2011 and 2015, agriculture workforce declined by 12.6 million, and the labour force increased by 14 million but total employmentin the economy increased only by 12 million. The incongruity in the figures proves the inability of the nonfarm sector to absorb residual workers out of work. Further, it is erroneous to premise the out of work farm labourers as an ultimate result of only innovation in agriculture. Status of unemployment has to be confessed and measures to provide employment has to be prioritized. It is apparent that the incumbent administration is resorting to the same banal and anodyne prescriptions that preceded it in its attempt to curry favour with the agricultural voter base, which had been promised employment during the 2014 election.

    The incessant crisis is evident from the past records of famers’ suicide data published by National Crime Records Bureau; however, the report faces severe criticisms for underreporting deaths. Though there are various socio psychological reasons for suicides, indebtedness has been considered the primary cause of death. A mere addition of cash transfer might marginally ameliorate farmers’ debts but heavy dependence on informal credit system requires the government to resolve the gaps in current credit system.

    Policy Challenge – Dealing with the Debt Problem

     The Debt Asset Ratio (DAR) indicates the quantum of indebtedness among farmers, since 1990 the ratio has increased at an astounding rate of 630 % in 2013. One commonly posited explanation for the skyrocketing DAR is the excessive informal borrowings by the farmers while the asset value remains stagnant. The perpetual ignorance by the government to address the structural issues over decades pushed the farmers to demonstrate a protest and subsequently resulted in the electoral setbacks of BJP post the protest.

    The apprehension is beyond agricultural and institutional policies, food inflation rates have fallen from 12.9 percent from 2013-14 to 0.13 percent in 2018. Even though the low inflation rates benefit the consumers in general- it would also imply the low food prices would be way below the input costs and return on private investment would be less if not non-existent. Government’s efforts have had little effect on keeping the inflation at a steady rate; the extreme movements of the inflation rates exacerbated the condition of the agrarian economy. The Government has announced to fix Minimum Support Price (MSP) at 50 % above the cost of production as per the recommendation of agricultural scientist Dr.Swaminathan. However, the recent protest placed a demand to change the method of arriving at the MSP figure. Pseudo free market behaviour from the government side has altered the market structure and mostly worked against the welfare of the marginal farmers. While the APMC (Agricultural Produce Marketing Committee) controls the MSP, the small farmers are expected to reach out to the market with a higher transaction cost and end up with much lower revenue. The state has failed to acknowledge the governance failure and continues to place MSP in an equivocal position in every budget. Cash transfers schemes have been placed in the budget with a similar ambiguity in terms of its impact on agricultural productivity and growth. There is a paucity of literature that provides a lucid explanation for execution of cash transfer. A recent study conducted in the rural parts of poor Indian states with 3,800 samples concluded that only 13% of the respondents preferred cash transfer over public health care facilities. Though it is not as same as providing cash transfer to farmers, similar schemes in the past have failed to create a sanguine impression and has made the beneficiaries dubious about such ambitious policies. The sample is also not a true representation of the agrarian community, sector which has been victimized for decades and would vote for short term benefits that risks stagnant productivity and falling workforce.

    The Paradox of Indian Agriculture

    Indian agriculture faces many challenges and is a paradox. India has the second largest area of 159 million hectares in the world as arable land, next only to the United States.  India is the second largest producer of Rice, Wheat, fruits and vegetables. India is the largest producer of bananas and mangoes. Export of agricultural products have ben growing at over 4% year on year. Despite all this there has been great volatility in agricultural economy over the last decade. Growth has been uneven, marginal farmers find farming becoming very uneconomical, and there has been significant decline in marginal farm holdings from 2.27 hectares in 2002 to 1.07 hectares in 2015. While big farmers have sustained themselves well, it is the marginal farmers who have continued to face increasing stress. While many encouraging policies and financial support schemes have been announced, in reality the implementation has been ineffective if not shoddy. Most planned investments and financial assistance have not reached the desired target populace.

     Investment in agriculture GDP has declined from 3.3 % in 1980-81 to 2.9 % in 2013-2014 while the subsidies on fertilizers has increased by 15 times in the same time frame after adjusting to inflation. Fertilizers subsidy accounts to 47 % of the total subsidy in the budget for the year 2017-2018 and amounts to almost Rs.70,000 crore.  Shenggen Fan and Ashok Gulati in their landmark studyto compare relative benefits of investments versus subsidies used a well-established statistical method ‘multi-equation system’. For every 10 lakh invested in agriculture pulled 328 people out of poverty and every one rupee spent on Research & Development increased the agriculture GDP by Rs11.20. The study also suggests that the inefficient input subsidies have actually been more counterproductive by hindering new investments and choking agriculture growth. Member of NITI Aayog and a renowned agronomist, Ramesh Chand had commented that research and development spend in India is not far behind China, a statement that calls for a reality check. For two decades India’s R&D spending as a percentage of GDP has been around 0.6 % while China spends around 2.1 % and Israel with the highest percentage if 4.2%. In absolute terms India invests 5 times lower than China and Israel. An effort on research & development is rather ostensible given less attention in the budget allocation.

    Conclusion : Need for Effective Policy Actions

     There is a conspicuous need for the government to assess the impact of cash transfer to farmers as a policy with various dimensions. The extent to which it can reconcile the distress in farming sector has to be scientifically proved to justify the quantum of investment for execution.  Heavily subsidized agriculture and loan waiver always helped with political victory but the fundamental crisis has been unceasing. Even an elementary study on trends in agriculture seems to highlight that it requires prompt moves and strong long term goals. Policies’ pertaining to agriculture has to be a parcel of broader strategies. Tactics of transferring cash with minimal sanction from experts reserves its place only as a political expediency.

    Marginal farmers and fragmented landholdings are the bottlenecks that prevent effective modernisation of Indian agriculture. The government will need to play a major role in evolving policies that create inclusive solutions to overcome the problems of marginal farmers. Agriculture in India continues to be in the grips of manual and subsistence farming without farm mechanisation or technological inputs. Average landholdings have shrunk from 2.28 hectares in 1970 to 1.08 hectare in 2015 (NABARD). Promoting cooperative farming will allow small and marginal farmers to take advantage of their family labour. Corporate farming, meanwhile, could allow economies of scale to kick in at lower thresholds.

    Yet again, hollow electioneering masquerades as policy with the advent of the great festival of democracy.  Now that the new government is in power, it is time that agriculture is given the due attention it deserves with a long-term strategy to resolve the problems of marginal farmers, fragmented land holdings, and the urgent need for rapid modernisation of agriculture and a national policy on water resources management.

    Manjari Balu is a Research Analyst at ‘The Peninsula Foundation”. She holds a degree in economics. Opinions expressed are the author’s own.

    Photo by Nandhu Kumar on Unsplash

  • The state of Bihar!?

    The state of Bihar!?

    The Prime Minister in the run up to the Bihar assembly elections announced a Rs.50,000 crores package for the state. Just as he announced a Rs.100,000 crores package for Jammu and Kashmir that July. Bihar has a population of over 103 million and J&K has a population of 12.5 million.

    This is not a new story. Bihar has been systematically exploited by denying it its rightful and deserved share of central funds from the First Plan.

    That Bihar is India’s poorest and most backward state is undeniable. The facts speak for themselves. But what makes its situation truly unique is that Bihar is the only state in India where the incidence of poverty is uniformly at the highest level (46-70%) in all the sub-regions. The annual real per capita income of Bihar of Rs. 3650 is about a third of the national average of Rs.11, 625. Bihar is also the only Indian state where the majority of the population – 52.47% – is illiterate.

    But Bihar has its bright spots also. Its infant mortality rate is 62 per 1000, which is below the national average of 66 per 1000. But what is interesting is that it is better than not just states like UP (83) and Orissa (91), but better than even states like Andhra Pradesh and Haryana (both 66).

    Even in terms of life expectancy, the average Bihari male lives a year longer (63.6 yrs.) than the average Indian male (62.4 yrs) and the state’s performance in increasing life spans has been better than most during the past three years.

    Bihar has 7.04 mn. hectares under agriculture and its yield of 1679 kgs. per hectare, while less than the national average of 1739 kgs. per hectare is better than that of six other states, which include some big agricultural states like Karnataka and Maharashtra.

    Despite this, in overall socio-economic terms, Bihar is quite clearly in a terrible shape.

    As opposed to an All-India per capita developmental expenditure during the last three years of Rs.7935.00, Bihar’s is less than half at Rs.3633.00. While development expenditure depends on a bunch of factors including a state’s contribution to the national exchequer, no logic can explain away the per capita Tenth Plan size, which at Rs. 2533.80 is less than a third of that of states like Gujarat (Rs.9289.10), Karnataka (Rs.8260.00) and Punjab (Rs.7681.20).

    Simple but sound economic logic tells us that when a region is falling behind, not just behind but well behind, it calls for a greater degree of investment in its progress and development. It is analogous to giving a weak or sick child in the family better nutrition and greater attention. Only in the animal kingdom do we see survival of the fittest with the weak and infirm neglected, deprived and even killed.

    But instead of this we see that Bihar is being systematically denied, let alone the additional assistance its economic and social condition deserves, but also what is its rightful due.

    From the pitiful per capita investment in Bihar, it is obvious that the Central Government has been systematically starving Bihar out of funds. Quite obviously Bihar has also paid the price for being politically out of sync with the central government for long periods. The last one was for a dozen years from 1992 to 2004. For the last one year Bihar had a government in New Delhi that was supposed to be favorably disposed to the regime in Patna.

    Quite clearly states that are in political sync do much better in terms of central assistance. Lets take a look at how Andhra Pradesh, a state that has stayed largely in political sync with New Delhi, has fared in the past few years. In terms of grants from the Central Government (2000 to 2005), Bihar fared poorly receiving only Rs. 10833.00 crores while AP got Rs. 15542.00 crores.

    Bihar has also been neglected as far as net loans from the center are concerned. It received just Rs.2849.60 as against Rs.6902.20 received by AP from 2000-02. It’s only in terms of per capita share of central taxes do we see Bihar getting its due. This gross neglect by the central government is reflected in the low per capita central assistance (additional assistance, grants and net loans from the center) received by Bihar in 2001. While AP received Rs.625.60 per capita, Bihar got a paltry Rs.276.70.

    The results of the economic strangulation of Bihar can be seen in the abysmally low investments possible in the state government’s four major development thrusts. Bihar’s per capita spending on Roads is Rs.44.60, which is just 38% of the national average, which is Rs.117.80. Similarly for Irrigation and Flood Control Bihar spends just Rs.104.40 on a per capita basis as opposed to the national average of Rs.199.20.

    Now the question of how much did Bihar “forego”? If Bihar got just the All-India per capita average, it would have got Rs. 48,216.66 crores for the 10th Five Year Plan instead of the Rs.21,000.00 crores it has been allocated.

    This trend was established in the very first five-year plan and the cumulative shortfall now would be in excess of Rs. 80,000.00 crores. That’s a huge handicap now to surmount. Then it would have got Rs. 44,830 crores as credit from banks instead of the Rs. 5635.76 crores it actually got, if it were to get the benefit of the prevalent national credit/deposit ratio.

    Similarly Bihar received a pittance from the financial institutions, a mere Rs.551.60 per capita, as opposed to the national average of Rs.4828.80 per capita. This could presumably be explained away by the fact that Bihar now witnesses hardly any industrial activity. But no excuses can be made for the low investment by NABARD. On a cumulative per capita basis (2000 to 2002) Bihar received just Rs.119.00 from NABARD as against Rs.164.80 by AP and Rs.306.30 by Punjab. It can be nobody’s argument that there is no farming in Bihar.

    If the financial institutions were to invest in Bihar at the national per capita average, the state would have got Rs.40, 020.51 crores as investment instead of just Rs.4571.59 crores that it actually received.

    Quite clearly Bihar is not only being denied its due share, but there is a flight of capital from Bihar, India’s poorest and most backward state. This is a cruel paradox indeed. The cycle then becomes vicious. This capital finances economic activity in other regions, leading to a higher cycle of taxation and consequent injection of greater central government assistance there. If one used harsher language one can even say that Bihar is being systematically exploited, and destroyed by denying it its rightful share of central funds.

    To even make a dent on the abysmal state that Bihar is now in, Bihar will need at least twice what it gets from the Centre, as of yesterday.


    Mohan Guruswamy is a prolific commentator on politics, economics, development and governance. He is a trustee of TPF. The views expressed are the author’s own.

  • The Economics Nobel: From the Esoteric to the Practical

    The Economics Nobel: From the Esoteric to the Practical

    Mohan Guruswamy                                                                                   October 15, 2018 : Commentary

    The Sveriges Riksbank Prize in Economic Sciences in Memory of Alfred Nobel was instituted in 1968 by the Swedish central bank, and laureates are selected by the Royal Swedish Academy of Sciences. It is commonly called the Nobel Prize in Economics, though the Nobel Endowment has nothing to do with it. It has mostly tended to go to scholars doing esoteric research in economics. Much of economic research has tended to be quite remote from influencing public policy. My professor at the Kennedy School of Government, Harvard University, Professor Thomas Schelling who taught me “game theory” used in nuclear strategy, and only sometimes in economics, got an Economics Nobel for just that in 2005. Now the trend from the esoteric and philosophical is moving towards the practical.

    This year two American economists, William Nordhaus and Paul Romer, were awarded the Nobel Prize in Economics for their work in two diverse areas, but current concerns. Nordhaus won it for his warning policymakers during the first stirrings of concern about climate change in the 1970s that their economic models were not properly taking account of the impact of global warming and he is seen as one of the pioneers of environmental economics.

    The co-winner – Romer – is seen as the prime mover behind the endogenous growth theory, “the notion that countries can improve their underlying performance if they concentrate on supply-side measures such as research and development, innovation and skills”. This simply means developing nations that want to get out of their rut, like India, must invest in quality education and R&D. Instead our bureaucratic centralism has created a huge system whose outcomes are so low grade, that mediocrity passes off as brilliance. The fact that Indian students and scholars have to go abroad to fully harness their brilliance and gain recognition tells us what has gone wrong with our system.

    Paul Romer has argued, “Technological change can be accelerated by the targeted use of state interventions in areas such as R&D tax credits and patent regulation”. He called it “post colonial endogenous growth theory”. This famously inspired the an Oxford don, the economist Derek Morris, to write an odd to it. Its the history of economic theory in verse and is very witty and clever. The relevant verse for us is:

    “Only inventions seemed to have any effect
    And from where these arose everyone was quite bereft
    So people then began to get rather weary
    Of the once almighty neoclassical growth theory

    A new explanation arrived,
    over which there was quite a fuss
    Technical progress – innovation, ideas – were “endogenous”

    Invention was crucial but needed embodiment
    In people – in skills – and in capital investment
    So these were important to make growth shine
    Although others had known this for a very long time.”

    But how does one nurture invention without a national mood? For it is now well understood that how we do as a nation depends a great deal on how we perceive ourselves? This psychological factor is now understood to be critical to sustained economic growth.

    Classical economics was linked closely with psychology. Adam Smith’s other great work was “The Theory of Moral Sentiments” and dealt with the psychological principles of individual behavior. Smith emphasized the concept of empathy, the capacity to recognize feelings that are being experienced by another being. Jeremy Bentham described “utilitarianism as the greatest happiness of the greatest number that is the measure of right and wrong” and is considered by many as the father of the welfare state. Classical economic theory, also known as laissez faire, claims that leaving individuals to make free choices in a free market results in the best allocation of resources. Since individuals made choices the emphasis was on understanding human beings and their behavior as individual and as groups.

    Neo-classical economists based their thinking on the assumptions that people have rational preferences; individuals maximize utility and firm’s profits; and people act independently. Consequently neo-classical economists distanced themselves from psychology and sought explanations for economic analysis heavily based on the concept of rational expectations. For most of the last century economics became increasingly mathematical. Much of economic theory came to be presented as mathematical models, mostly calculus, to clarify assumptions and implications.

    It is not as if the switch was complete. Many great economists like Vilfredo Pareto, John Maynard Keynes and Joseph Schumpeter continued to base their analysis on psychological explanations.

    In more recent times this school of economics has been given greater importance and is reflected in the award of Nobel Prizes to behavioral economists like Daniel Kahneman of Princeton University and last year to Richard Thaler. Making the announcement Nobel Committee said: “His empirical findings and theoretical insights have been instrumental in creating the new and rapidly expanding field of behavioral economics, which has had a profound impact on many areas of economic research and policy.”

    There is a delicious irony in the award of the Nobel to Richard H. Thaler. He works in the University of Chicago, the nursery of classical economics, where he is the Ralph and Dorothy Keller Distinguished Service Professor of Behavioral Science and Economics at the Booth School of Business. Incidentally Raghuram Rajan who is also an economics professor is a colleague, was reported to also being considered for the Nobel for his “contributions illuminating the dimensions of decisions in corporate finance”.

    The dominance of the classical school on the world of economics can be gauged by the fact that since the relatively recent inception of the Nobel Prize in Economics in 1968, the Chicago economics department faculty have won the Nobel as many as twelve times, twice as many as MIT, which has six Nobel laureates. Seen from Harvard University’s ivory tower even MIT is considered as leaning more towards classical economic theory. Recent Harvard winners for economics such as Oliver Hart (2016), Alvin Roth (2012) and Eric Maskin (2007) were rewarded for their work based on mathematical empiricism than behavioral speculation. Amartya Sen (1998) was one of the few who broke this mold and won it in recognition of his work and abiding interest in welfare economics.

    Every politician worth his salt knows that national mood and perceptions are decisive in determining national outcomes. And often people do not always make rational choices, something that marketers of diverse products such as automobiles and soap, and political dreams know. But economists took their time recognizing this, and the Nobel Committee even longer. Better late than never.


    Mohan Guruswamy is a well known political and economics commentator. He is a Trustee of TPF.